Fig. 2
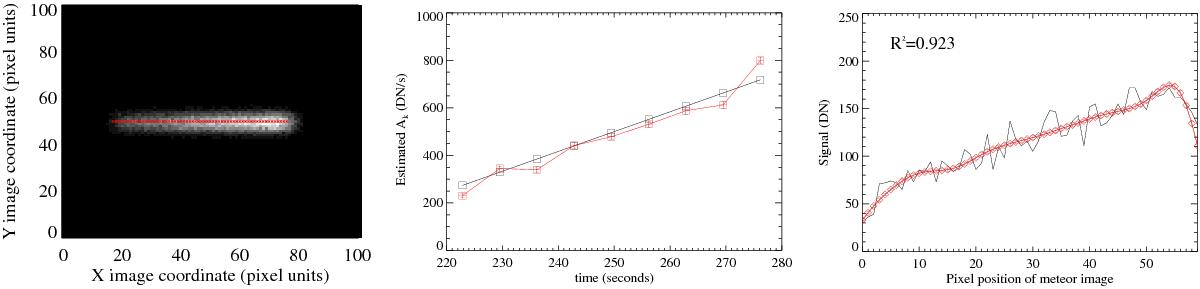
Left panel: synthetic image of a moving source of increasing flux. The red dots denote the pixel locations of the measurements. Middle panel: the initial choice for the source flux over time (black squares) and the estimates from the least-squares fit (red squares). Right panel: the synthetic signal along the central pixel row of the meteor (black curve) and the reconstructed values from the Ak estimates (red diamonds). The value of the goodness-of-fit quantity is indicated in the upper left while the grey error bars represent 1σ formal uncertainties.
Current usage metrics show cumulative count of Article Views (full-text article views including HTML views, PDF and ePub downloads, according to the available data) and Abstracts Views on Vision4Press platform.
Data correspond to usage on the plateform after 2015. The current usage metrics is available 48-96 hours after online publication and is updated daily on week days.
Initial download of the metrics may take a while.