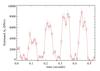
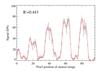
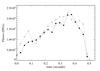
Fig. 12
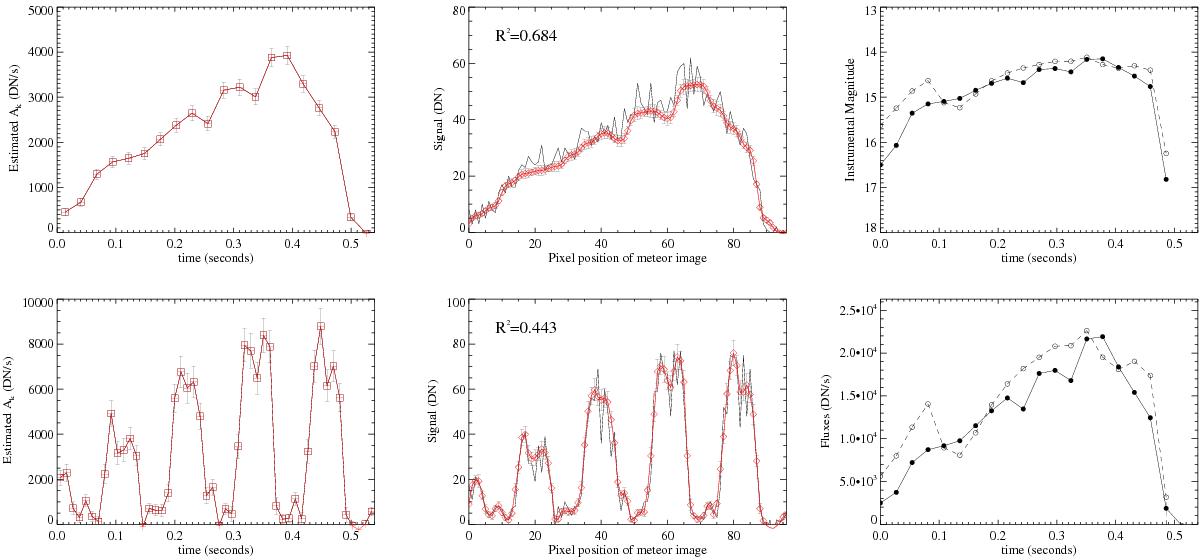
Analysis results of meteor shown in Fig 11. Top left: estimated flux over time for the uninterrupted image. Top middle: meteor signal (continuous line) along the measurement vector compared to the signal estimates from the fit (red diamonds). Top right: comparison of instrumental magnitude estimates from the uninterrupted (continuous line) and interrupted (dashed line) images. Bottom left: as top left panel, but for the interrupted image. Bottom middle: as top middle panel, but for the interrupted image. Bottom right: as top right panel, but for the flux.
Current usage metrics show cumulative count of Article Views (full-text article views including HTML views, PDF and ePub downloads, according to the available data) and Abstracts Views on Vision4Press platform.
Data correspond to usage on the plateform after 2015. The current usage metrics is available 48-96 hours after online publication and is updated daily on week days.
Initial download of the metrics may take a while.