Fig. 10
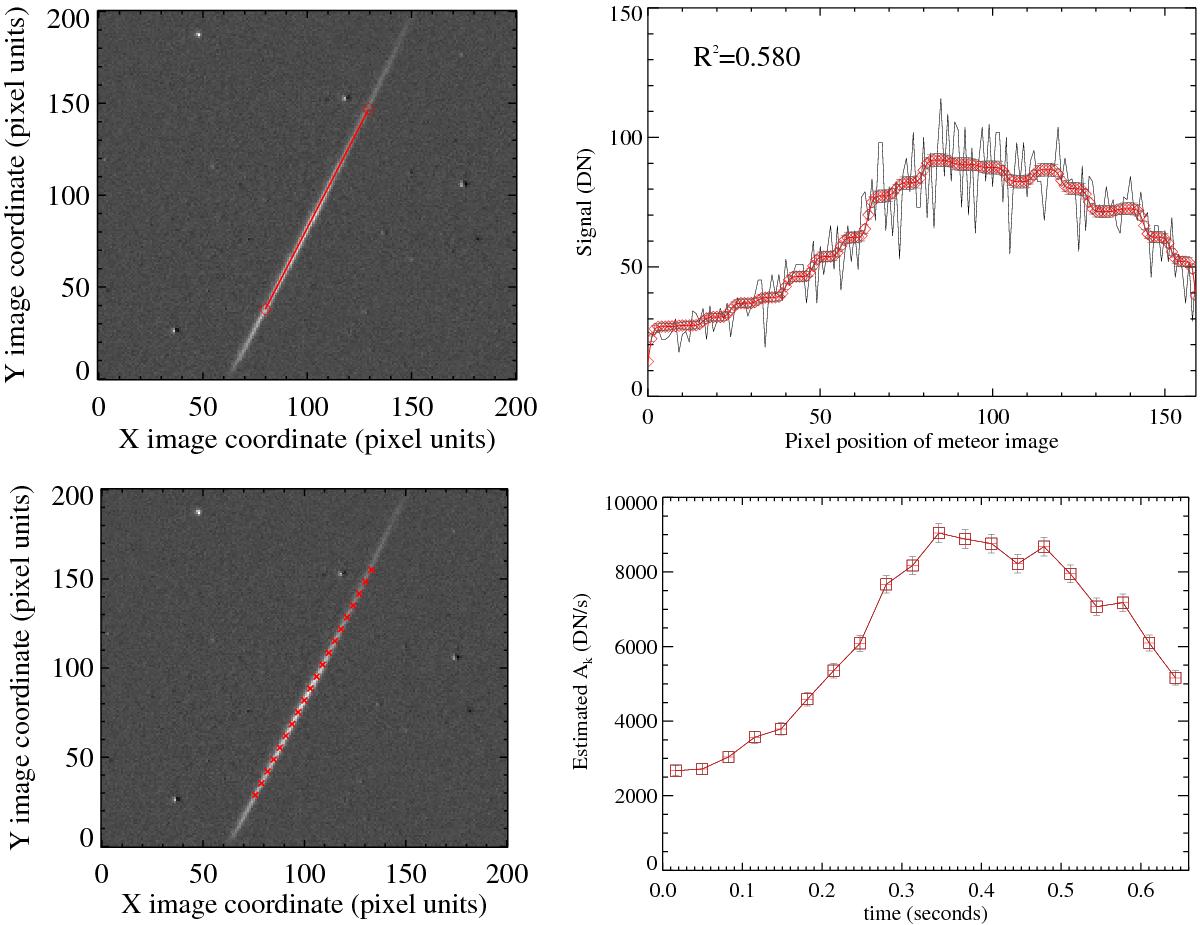
Analysis results of meteor shown in Fig. 9. Top left: difference image (see text) showing the measurements (red line bracketed by the two red diamonds) used to run the model on. Top right: model fit (red diamonds) to the measurements (black line). Bottom left: difference image indicating the positions (or, equivalently, the times) along the meteor trajectory when the flux was estimated. Bottom right: estimated flux as a function of time, from the moment the meteor reached the beginning of the measurement vector.
Current usage metrics show cumulative count of Article Views (full-text article views including HTML views, PDF and ePub downloads, according to the available data) and Abstracts Views on Vision4Press platform.
Data correspond to usage on the plateform after 2015. The current usage metrics is available 48-96 hours after online publication and is updated daily on week days.
Initial download of the metrics may take a while.