Fig. 8
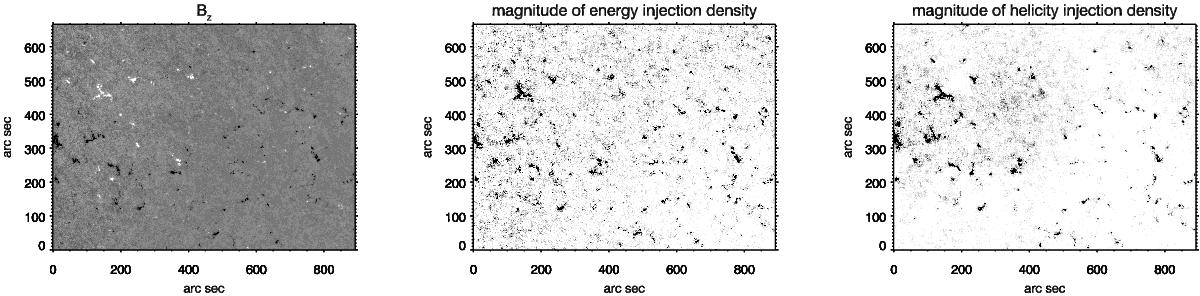
Vertical magnetic field component Bz (left panel) for the vector magnetogram of July 15, 2014 at 23:42 UT, with white and black denoting positive and negative magnetic field concentrations. Respective derived gray-scale maps of the magnitude of energy injection density (middle panel) and the magnitude of helicity injection density (right panel) with black denoting high values.
Current usage metrics show cumulative count of Article Views (full-text article views including HTML views, PDF and ePub downloads, according to the available data) and Abstracts Views on Vision4Press platform.
Data correspond to usage on the plateform after 2015. The current usage metrics is available 48-96 hours after online publication and is updated daily on week days.
Initial download of the metrics may take a while.