Fig. 3
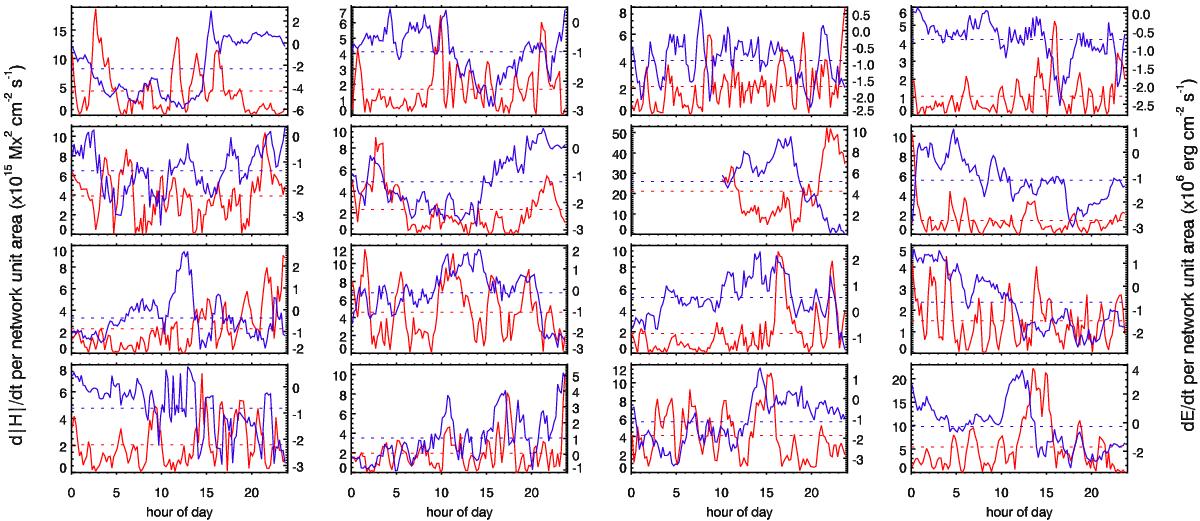
Absolute helicity and the energy rate variation per network unit area (red and blue solid lines, and left and right ordinate, respectively) for our 16 daily SDO/HMI quiet-Sun magnetogram sequences (only the seventh magnetogram sequence starts later at 10:00 UT). For clarity in assessing the long-term evolution of helicity and energy rates, all shown curves are one-hour averages of the actual curves. The dotted red and blue lines denote the corresponding values of the mean helicity amplitude rate and energy rate per network unit area, respectively (see also Fig. 7).
Current usage metrics show cumulative count of Article Views (full-text article views including HTML views, PDF and ePub downloads, according to the available data) and Abstracts Views on Vision4Press platform.
Data correspond to usage on the plateform after 2015. The current usage metrics is available 48-96 hours after online publication and is updated daily on week days.
Initial download of the metrics may take a while.