Fig. 2
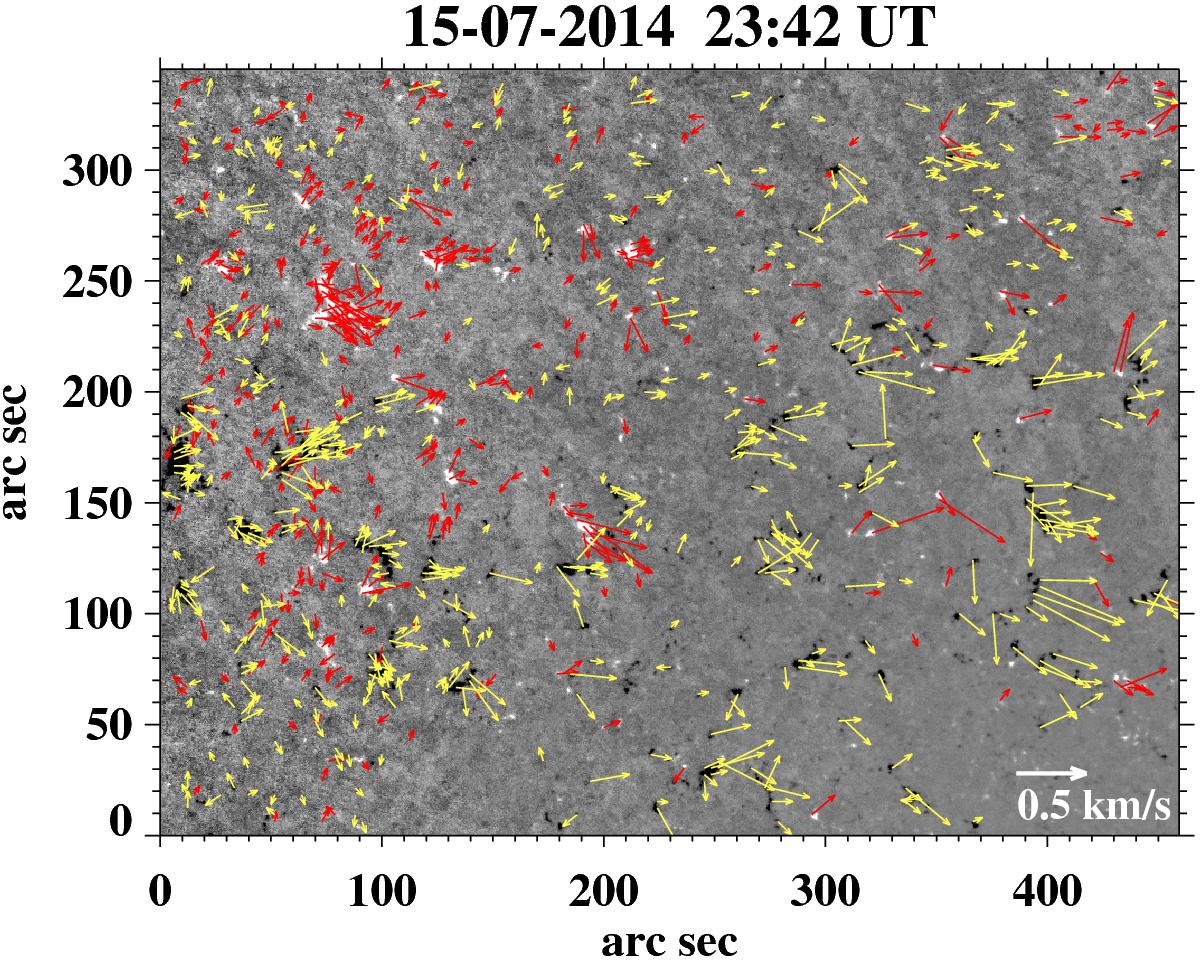
Derived photospheric velocity field (yellow and red arrows) calculated with DAVE4VM for a vector magnetogram of the sequence of July 15, 2014, on top of a gray-scale image of the normal component of the magnetic field. A threshold of 0.07 km s-1 for velocities and 20 G for the magnetic field was used when plotting the velocity field. Black and white denotes positive and negative magnetic field concentrations, respectively. Yellow and red velocity arrows are associated with positive and negative fields, respectively. The white arrow at the bottom right corner indicates the velocity scale.
Current usage metrics show cumulative count of Article Views (full-text article views including HTML views, PDF and ePub downloads, according to the available data) and Abstracts Views on Vision4Press platform.
Data correspond to usage on the plateform after 2015. The current usage metrics is available 48-96 hours after online publication and is updated daily on week days.
Initial download of the metrics may take a while.