Free Access
Fig. 1
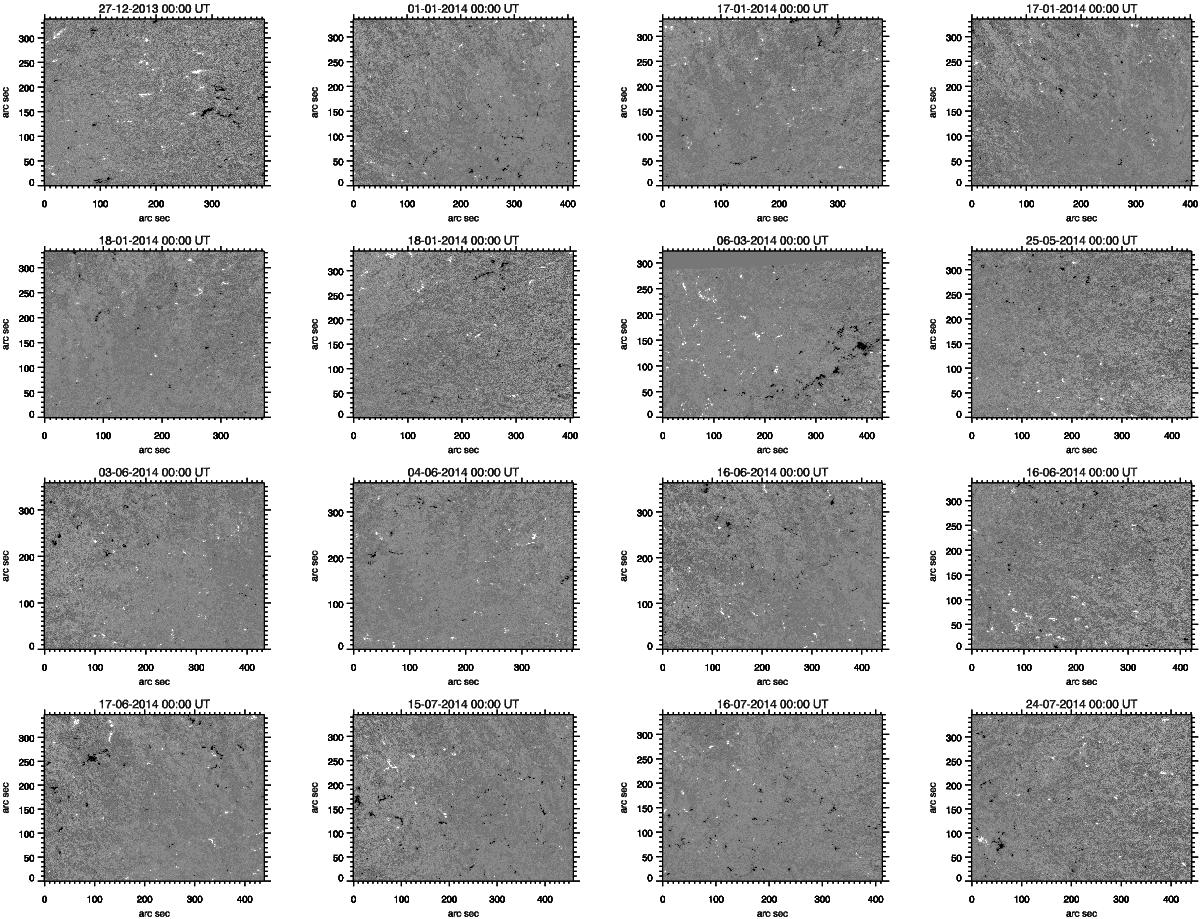
Vertical magnetic field component Bz at 00:00 UT for all 16 SDO/HMI quiet-Sun magnetogram sequences in our study. White and black denote positive and negative magnetic field concentrations. Same dates correspond to quiet-Sun regions observed in different locations on the solar disk.
Current usage metrics show cumulative count of Article Views (full-text article views including HTML views, PDF and ePub downloads, according to the available data) and Abstracts Views on Vision4Press platform.
Data correspond to usage on the plateform after 2015. The current usage metrics is available 48-96 hours after online publication and is updated daily on week days.
Initial download of the metrics may take a while.