Fig. 1
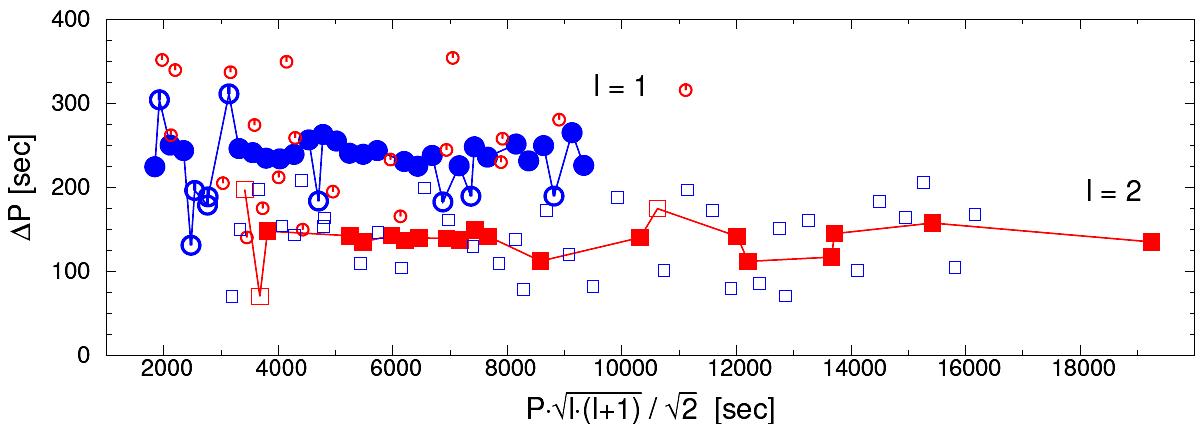
ΔP vs. reduced period (divided by ![]() ) diagram for l = 1 (large blue filled and open circles) and l = 2 (large red filled and open squares). Large open symbols represent periods that deviated more than 30 s from the period spacing fit. Small symbols represent l = 1 (blue small open squares) or l = 2 (red small open circles) calculated with the period spacing fit of another mode.
) diagram for l = 1 (large blue filled and open circles) and l = 2 (large red filled and open squares). Large open symbols represent periods that deviated more than 30 s from the period spacing fit. Small symbols represent l = 1 (blue small open squares) or l = 2 (red small open circles) calculated with the period spacing fit of another mode.
Current usage metrics show cumulative count of Article Views (full-text article views including HTML views, PDF and ePub downloads, according to the available data) and Abstracts Views on Vision4Press platform.
Data correspond to usage on the plateform after 2015. The current usage metrics is available 48-96 hours after online publication and is updated daily on week days.
Initial download of the metrics may take a while.