Fig. 5
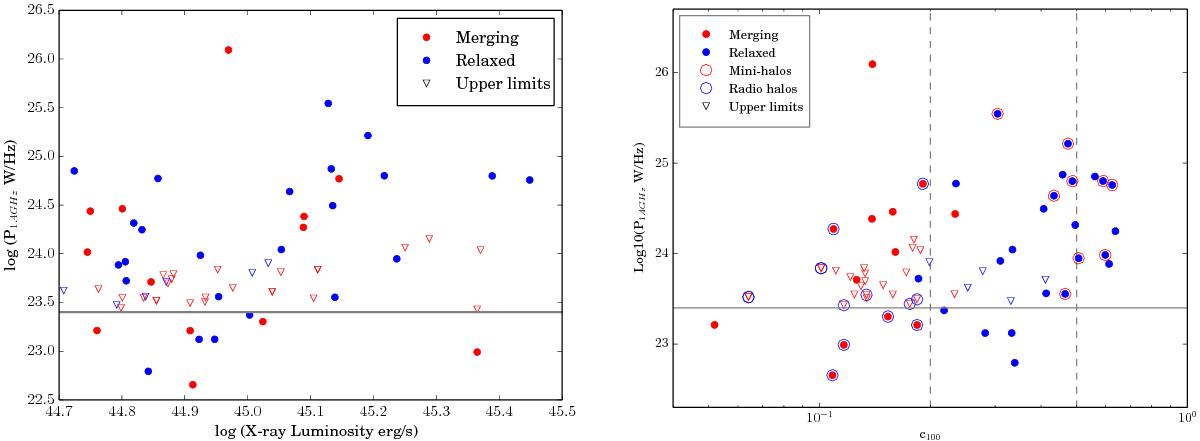
Left panel: distribution of the log LX–log P1.4 GHz for the sample, where log LX is the X-ray luminosity of the host cluster. Undetected BCGs are shown as triangles (blue for relaxed, red for merging clusters). The objects below the grey line are those undetected in NVSS that were removed from the statistical study. Right panel: distribution of the radio power of the BCGs in the sample as a function of the concentration parameter of the hosting cluster (c100). Merging clusters are shown as red dots, relaxed clusters are blue circles. Upper limits in each class are shown as triangles, with the same colour code. The information on the presence of mini-halos in relaxed systems and radio halos in merging clusters is also shown. The grey horizontal line is the same as in the left panel. Dashed vertical lines are drawn at c100 = 0.2 and 0.5 (see Sect. 5.1).
Current usage metrics show cumulative count of Article Views (full-text article views including HTML views, PDF and ePub downloads, according to the available data) and Abstracts Views on Vision4Press platform.
Data correspond to usage on the plateform after 2015. The current usage metrics is available 48-96 hours after online publication and is updated daily on week days.
Initial download of the metrics may take a while.