Fig. 4
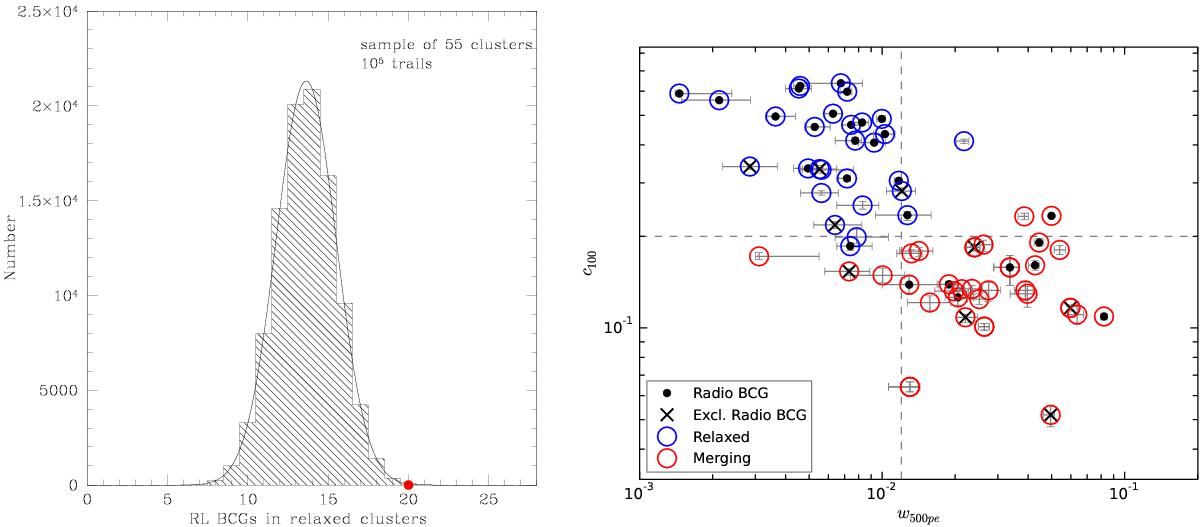
Left panel: result of the Monte Carlo calculations. The histogram shows the distribution of the radio-loud BCGs in relaxed clusters after 105 trials. The red dots shows the 3.4σ location of our observed result compared to the random distribution. Right panel: distribution of the BCGs in the w500–c100 space. Relaxed clusters are shown as blue circles, and are all located in the upper left quadrant; merging clusters are shown as red cicles and occupy the lower right portion. Filled black circles are the radio-loud BCGs, the black crosses show the BCGs with radio emission that have been removed from the analysis (Sect. 3.1). The threshold values to classify clusters as mergers are the same as in C10, i.e., P3/P0> 1.2 × 10⁻⁷, w500> 0.012 and c100< 0.20.
Current usage metrics show cumulative count of Article Views (full-text article views including HTML views, PDF and ePub downloads, according to the available data) and Abstracts Views on Vision4Press platform.
Data correspond to usage on the plateform after 2015. The current usage metrics is available 48-96 hours after online publication and is updated daily on week days.
Initial download of the metrics may take a while.