Fig. 1
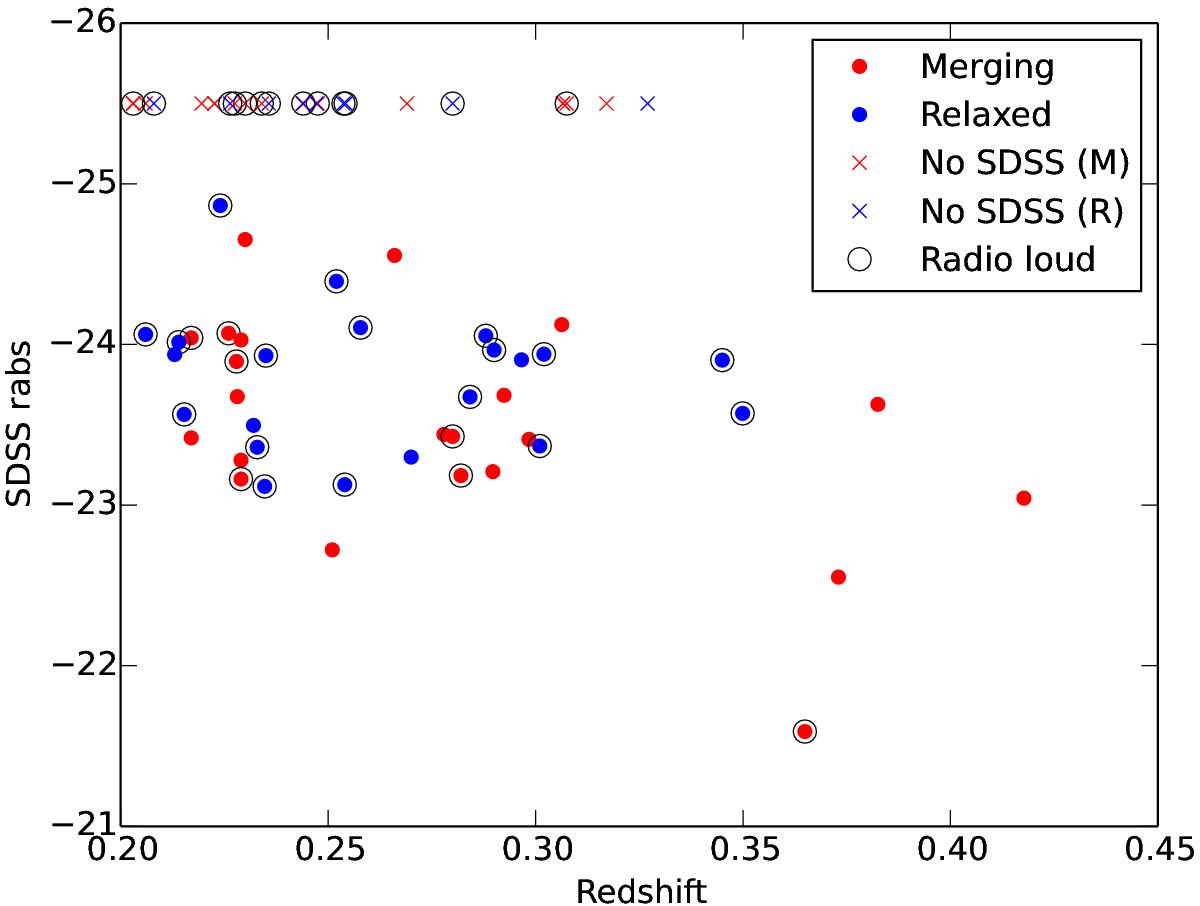
Distribution of the SDSS absolute red magnitude of the BCGs in the sample. Red and blue dots show the BCGs in merging and relaxed clusters, respectively (see Sect. 3.2). Crosses show the BCGs without optical information, with the same colour code. Black circles show the galaxies with radio emission (see Sect. 3.1 and Tables 1 and 2).
Current usage metrics show cumulative count of Article Views (full-text article views including HTML views, PDF and ePub downloads, according to the available data) and Abstracts Views on Vision4Press platform.
Data correspond to usage on the plateform after 2015. The current usage metrics is available 48-96 hours after online publication and is updated daily on week days.
Initial download of the metrics may take a while.