Fig. 1
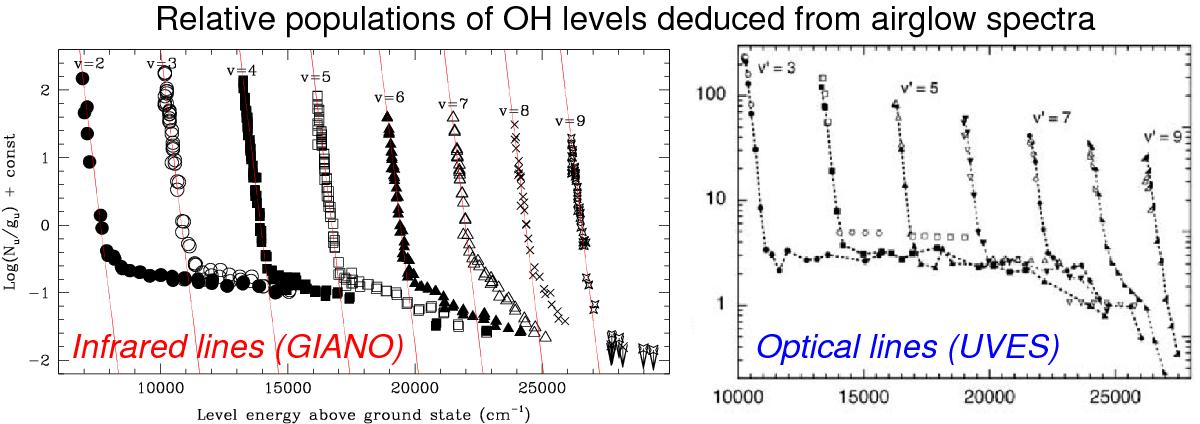
Derived column densities of the OH levels plotted against the energy of the levels above the ground state of the molecule. Left panel: values derived from the infrared lines discussed here; right panel: reproduced with permission from Fig. 16 of Cosby & Slanger (2007); © Canadian Science Publishing or its licensors – summarises the results based on optical (UVES) spectra. The steep straight lines in the left panel show the distribution predicted by standard models with rotational levels thermalised at 200 K. The quasi-flat tails reveal the hot-OH component, see Sect. 3.1 for details.
Current usage metrics show cumulative count of Article Views (full-text article views including HTML views, PDF and ePub downloads, according to the available data) and Abstracts Views on Vision4Press platform.
Data correspond to usage on the plateform after 2015. The current usage metrics is available 48-96 hours after online publication and is updated daily on week days.
Initial download of the metrics may take a while.