Fig. 6
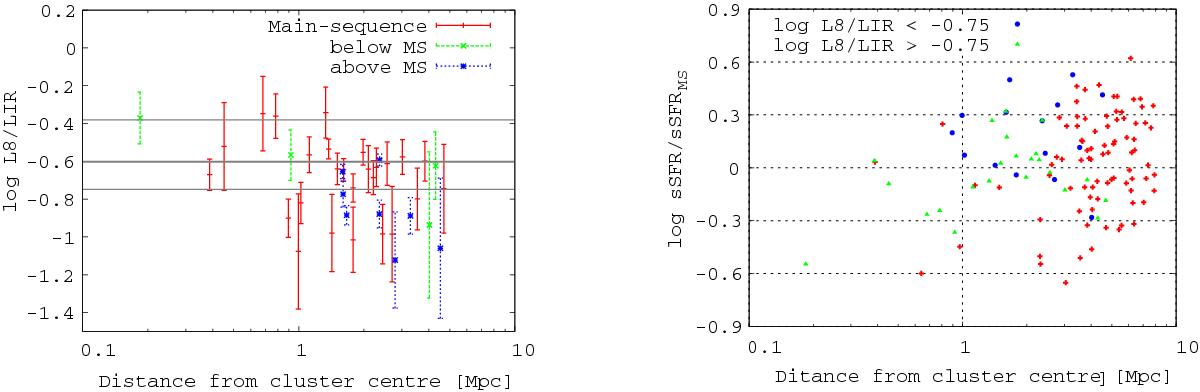
Left: L8/LIR vs. distance from the cluster centre. The green, red, and blue points indicate the below, on, and above main-sequence galaxies in Fig. 3. The grey lines indicate the average and the range of L8/LIR for main-sequence galaxies in Elbaz et al. (2011). Right: sSFR divided by that of main-sequence galaxies from Rodighiero et al. (2010). The blue circles and the green triangles indicate galaxies with log L8/LIR <−0.75 and >−0.75. The red crosses indicates galaxies without L15 band detection.
Current usage metrics show cumulative count of Article Views (full-text article views including HTML views, PDF and ePub downloads, according to the available data) and Abstracts Views on Vision4Press platform.
Data correspond to usage on the plateform after 2015. The current usage metrics is available 48-96 hours after online publication and is updated daily on week days.
Initial download of the metrics may take a while.