Fig. 4
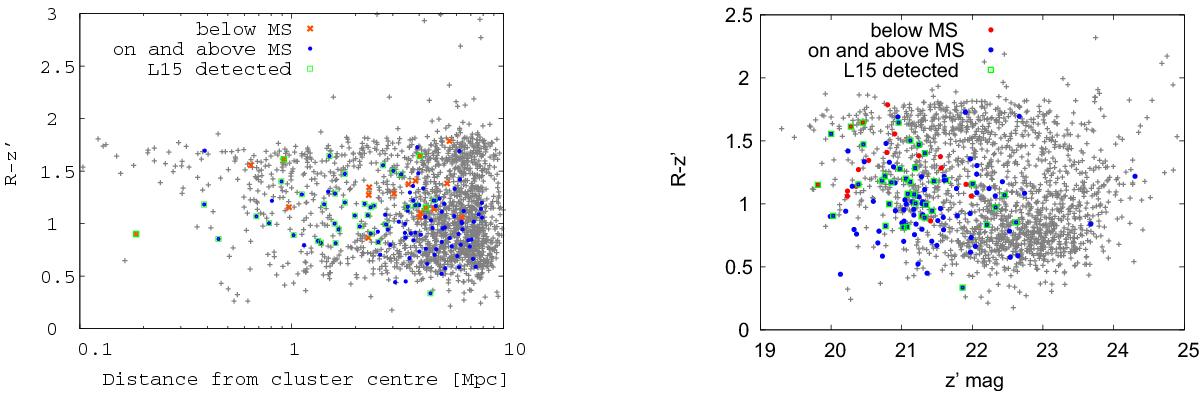
Left: R − z′ colour vs. distance from the cluster centre. The red crosses and the blue circles indicate sources below and on/above the main-sequence galaxies classified in Fig. 3. L15 detected galaxies are indicated by the green squares. MIPS24 non-detected galaxies are plotted with grey points. Right: R − z′ vs. z′ colour−magnitude diagram. The symbols are the same as the left panel.
Current usage metrics show cumulative count of Article Views (full-text article views including HTML views, PDF and ePub downloads, according to the available data) and Abstracts Views on Vision4Press platform.
Data correspond to usage on the plateform after 2015. The current usage metrics is available 48-96 hours after online publication and is updated daily on week days.
Initial download of the metrics may take a while.