Free Access
Fig. 3
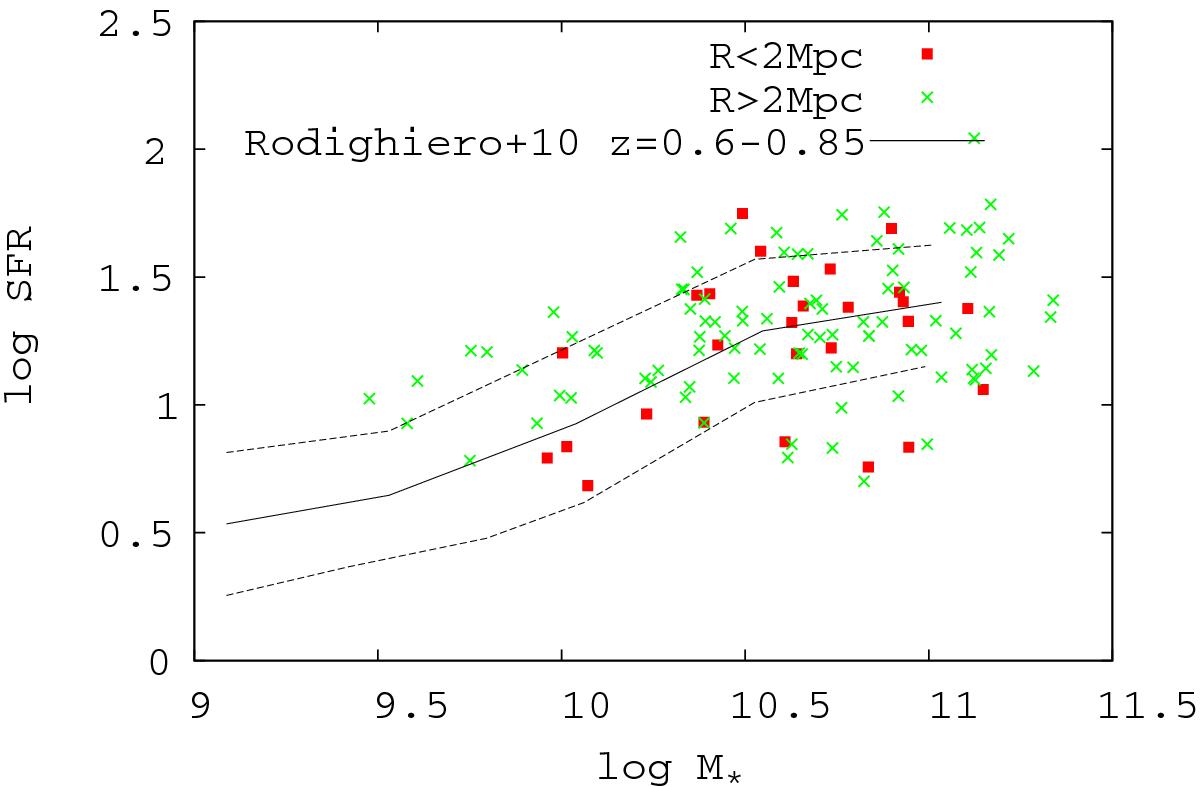
Star formation rate vs. stellar mass. The red squares and the green crosses indicate galaxies located in R< 2 Mpc and R> 2 Mpc, respectively. The black solid and broken lines indicate the average and the 1σ range of main-sequence relation for field galaxies at z = 0.6−0.85 (Rodighiero et al. 2010).
Current usage metrics show cumulative count of Article Views (full-text article views including HTML views, PDF and ePub downloads, according to the available data) and Abstracts Views on Vision4Press platform.
Data correspond to usage on the plateform after 2015. The current usage metrics is available 48-96 hours after online publication and is updated daily on week days.
Initial download of the metrics may take a while.