Fig. 9
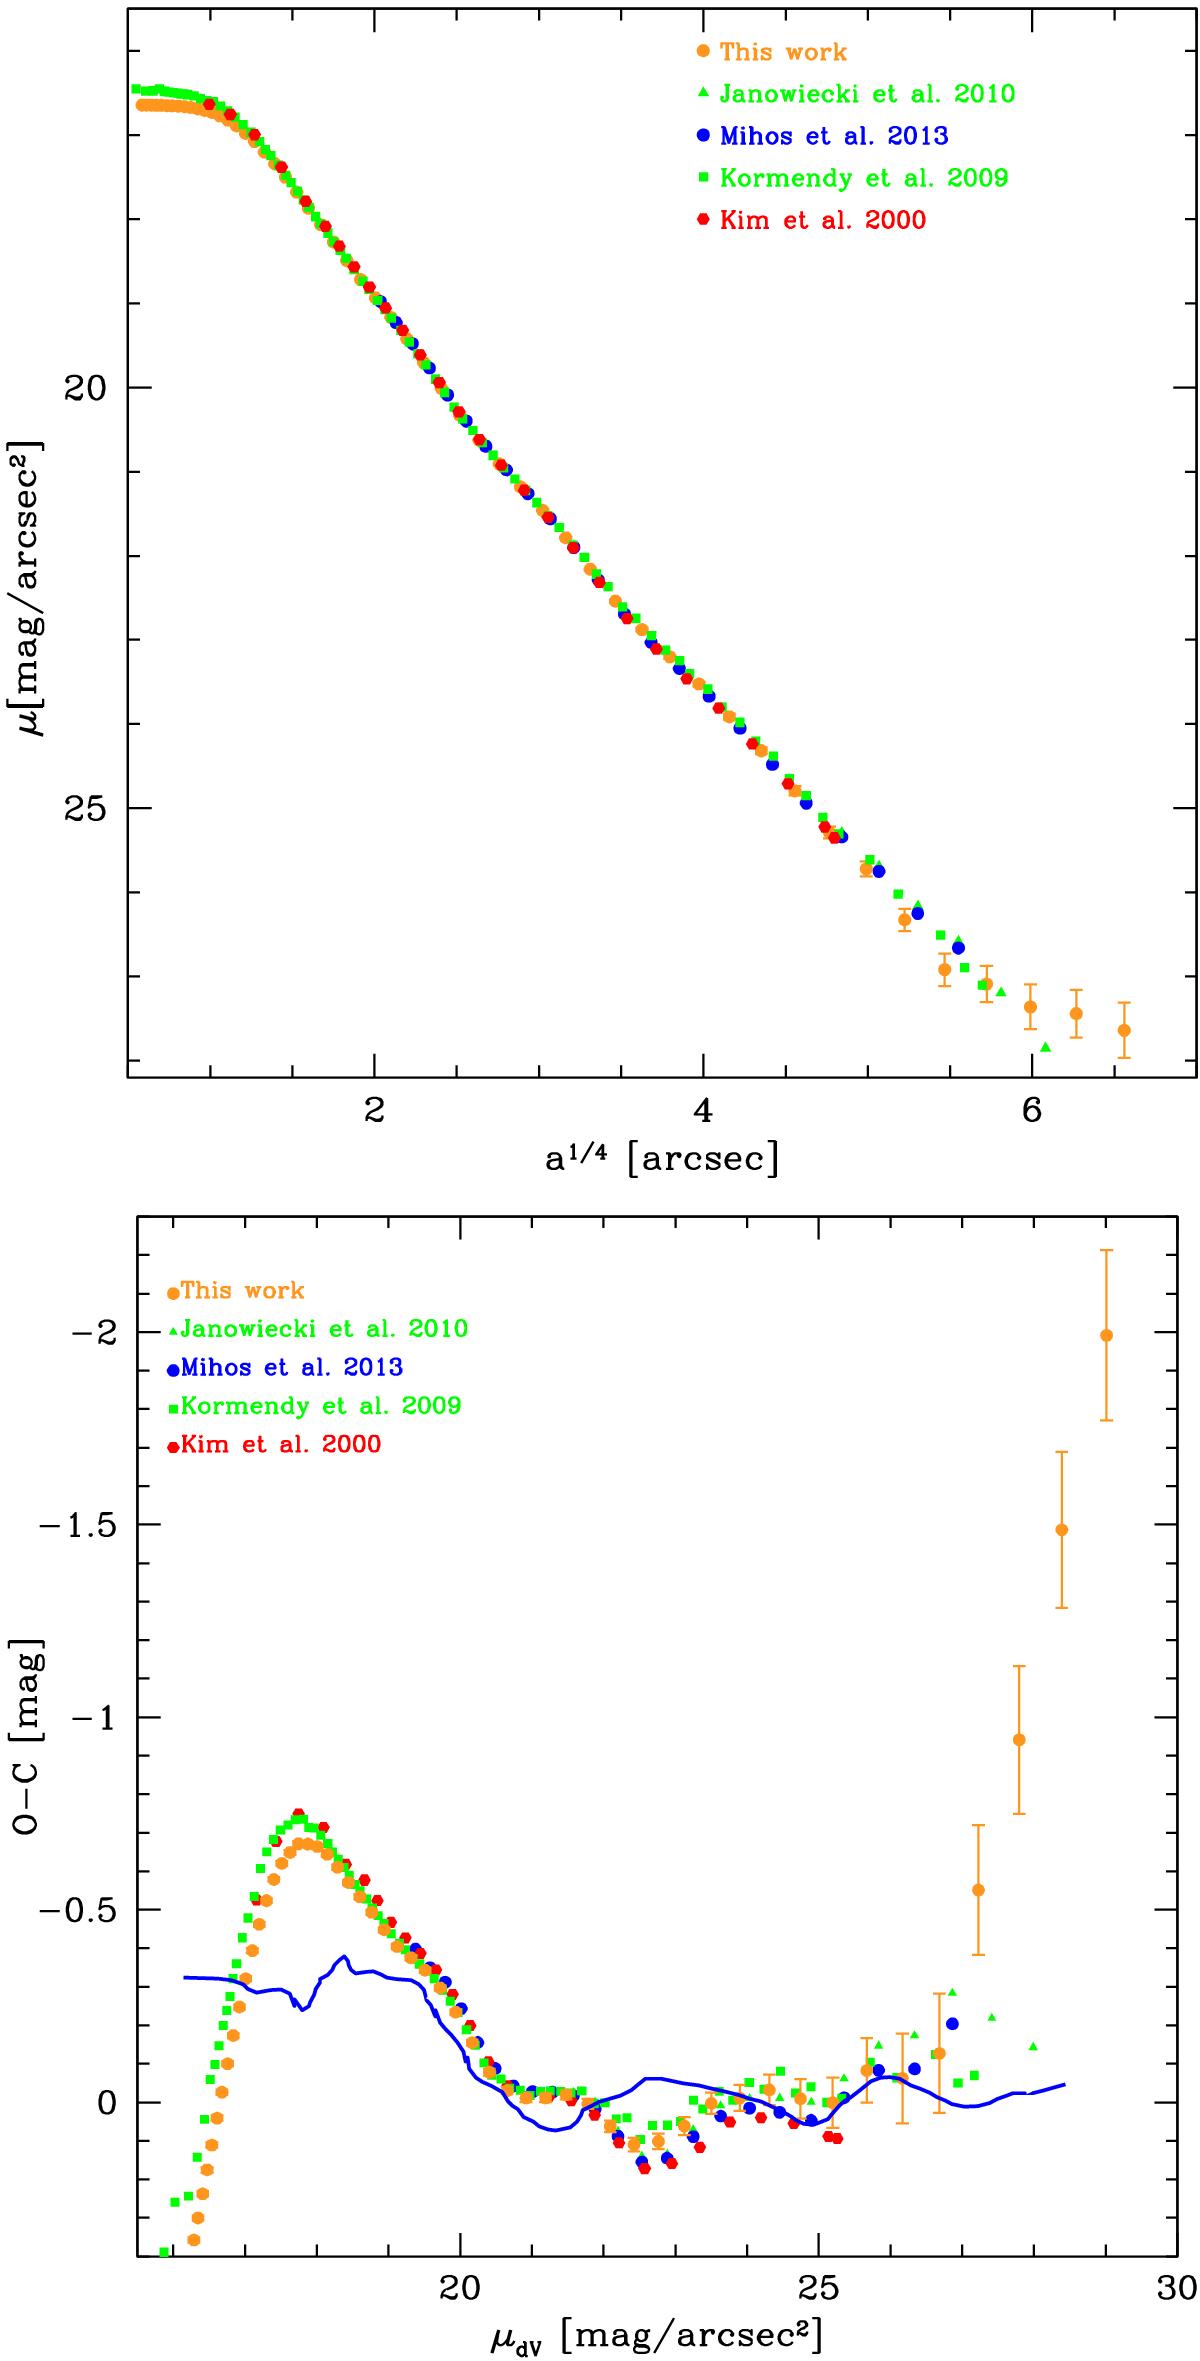
NGC 4472. Top panel: azimuthally averaged g-band profile from VEGAS compared to literature. The color code of the symbols mimicks the corresponding photometric bands. Arbitrary shifts have been used to match with the VEGAS profile. In particular, the B-band profile byMihos et al. (2013) has been shifted by −0.35 mag, the V band from Kormendy et al. (2009) and Janowiecki et al. (2010) by +0.35 mag, and the profile by Kim et al. (2000) by +0.92 mag. Bottom panel: (O–C) residuals of mean profiles from a best-fitting r1 / 4 model used only to remove the main gradient and facilitate comparison. The blue solid line plots the (O–C) residuals for the east-west photometric cross-section of the standard elliptical galaxy NGC 3379 from de Vaucouleurs & Capaccioli (1979). There are clear similarities: the bright core and a wavy trend overimposed on the smooth r1 / 4 trend.
Current usage metrics show cumulative count of Article Views (full-text article views including HTML views, PDF and ePub downloads, according to the available data) and Abstracts Views on Vision4Press platform.
Data correspond to usage on the plateform after 2015. The current usage metrics is available 48-96 hours after online publication and is updated daily on week days.
Initial download of the metrics may take a while.