Fig. 8
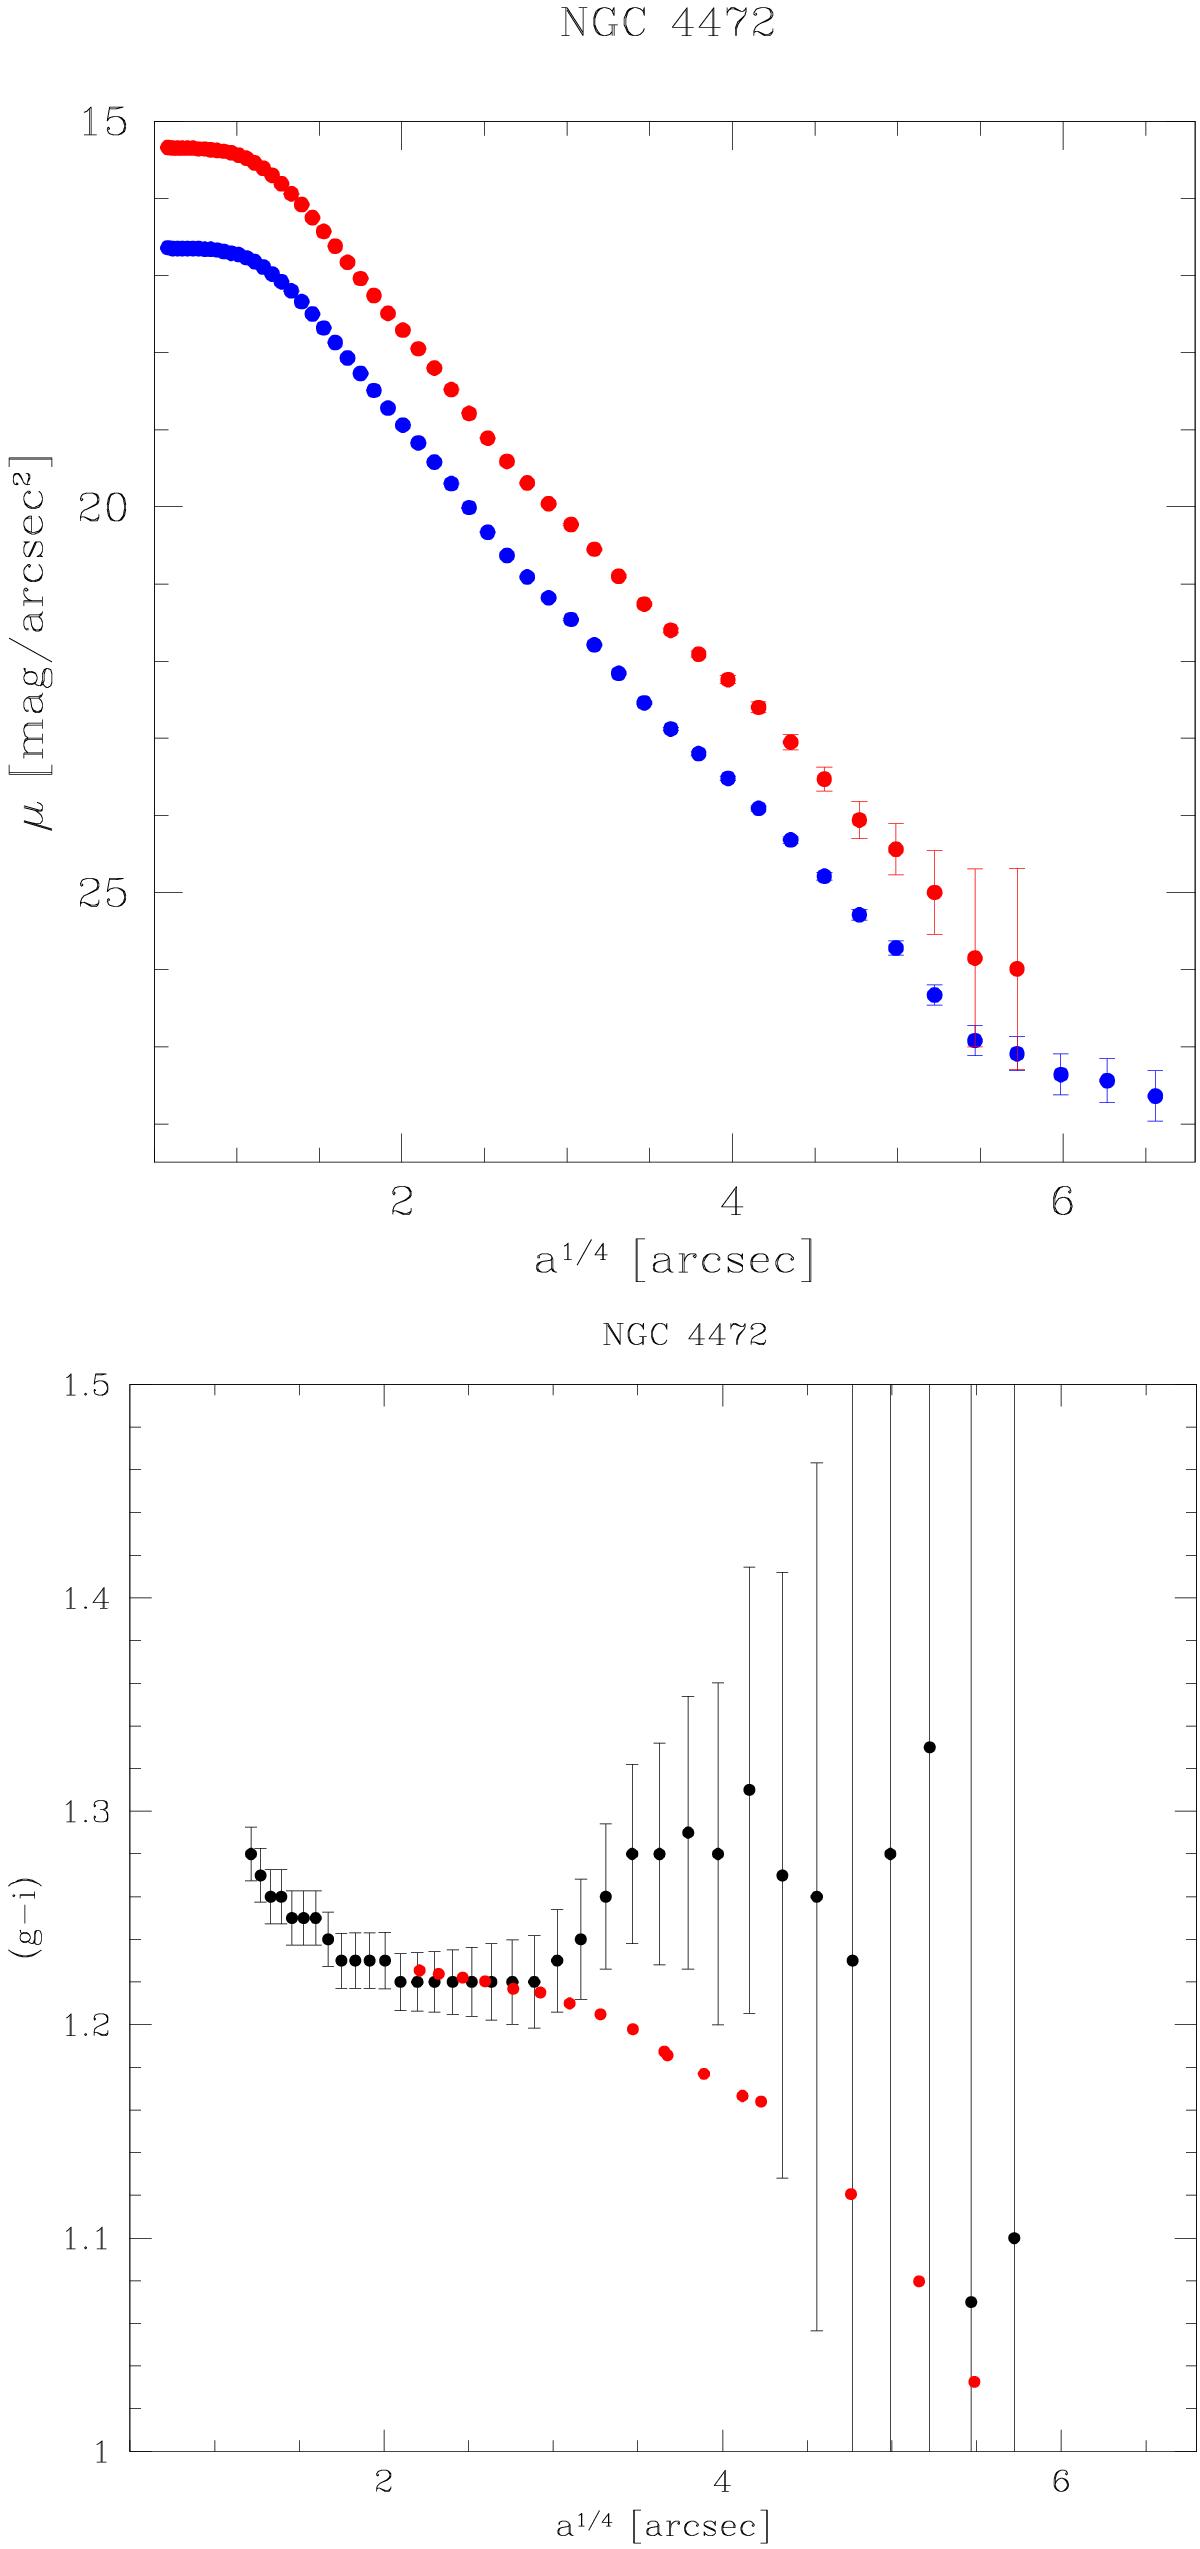
NGC 4472. Top: azimuthally averaged light profiles in the g (blue) and i (red) bands. Bottom: (g − i) color profile in the region (a> 2 arcsec) unaffected by differential seeing. The red dots trace the (B − V) profile published by Mihos et al. (2013) shifted by +0.25 mag, measured in the regions of high S/N for both datasets. The comparison supports the blueward gradient that we found for a/ae> 4, although with very large errors.
Current usage metrics show cumulative count of Article Views (full-text article views including HTML views, PDF and ePub downloads, according to the available data) and Abstracts Views on Vision4Press platform.
Data correspond to usage on the plateform after 2015. The current usage metrics is available 48-96 hours after online publication and is updated daily on week days.
Initial download of the metrics may take a while.