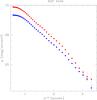
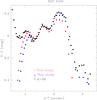
Fig. 15
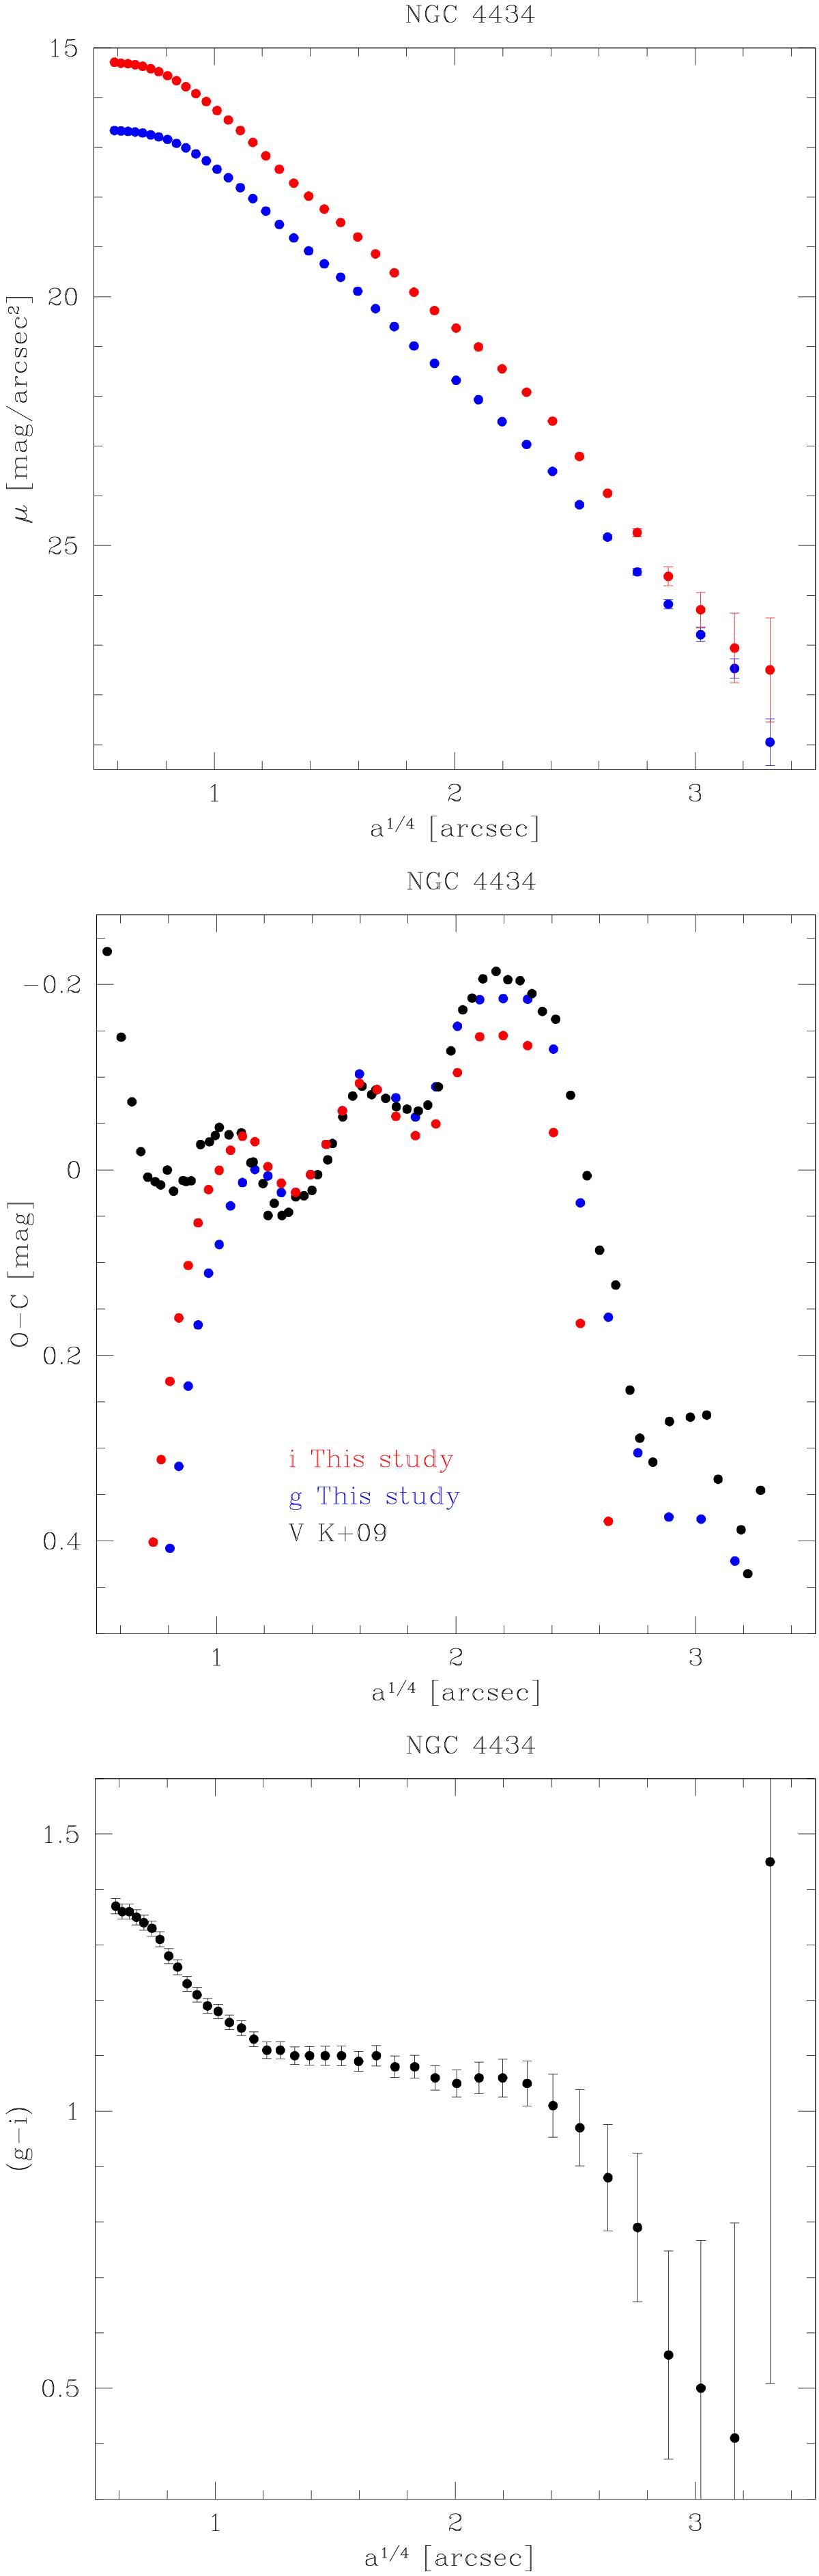
NGC 4434. Top panel: azimuthally averaged light profiles in the g (blue) and i (red) bands. Center panel: (O−C) residuals of the VEGAS profiles and the V-band profile of K+09 with respect to the best-fitting r1 / 4 model (see Table 4). The best match is obtained with the shifts listed in Table 5. VEGAS data for a1 / 4< 1.2 are affected by seeing. Bottom panel: (g − i) color profile. Again the data at a1 / 4< 1.2 have not been corrected for seeing.
Current usage metrics show cumulative count of Article Views (full-text article views including HTML views, PDF and ePub downloads, according to the available data) and Abstracts Views on Vision4Press platform.
Data correspond to usage on the plateform after 2015. The current usage metrics is available 48-96 hours after online publication and is updated daily on week days.
Initial download of the metrics may take a while.