Fig. 8
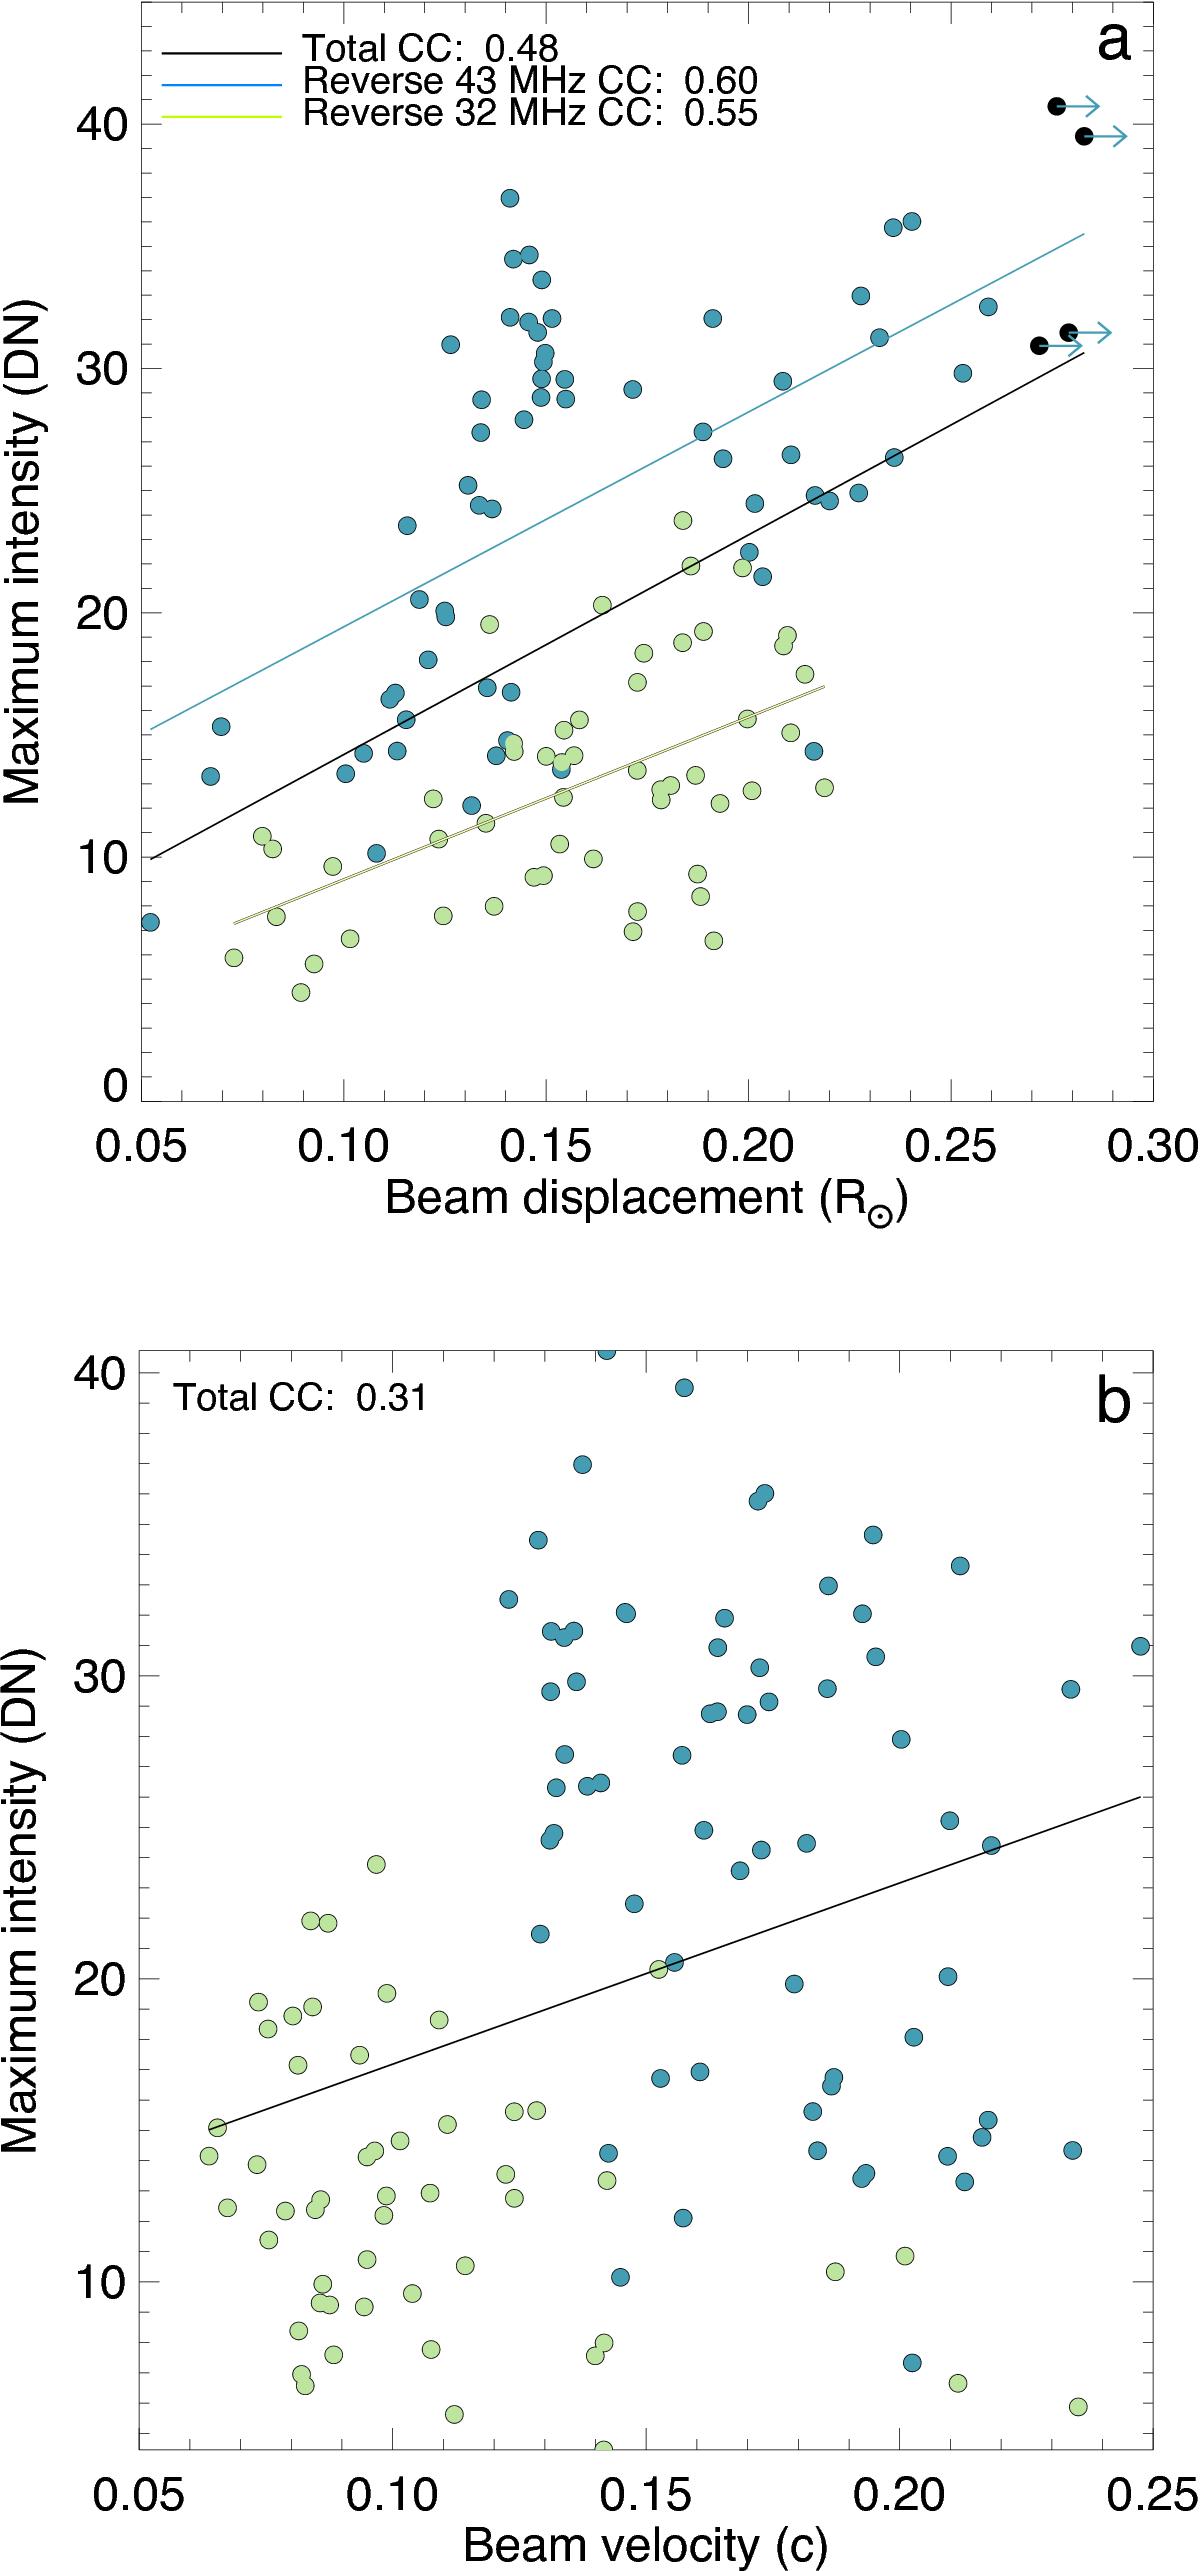
a) Scatter plot of beam displacement (using the TCD density model) against burst maximum intensity above the background, for reverse drift burst only. All bursts together show a weak positive correlation coefficient of 0.48, meaning the more intense the bursts the further they may travel in space. There is a clear separation in intensity between the two types of reverse drift bursts. By themselves, the reverse drift bursts starting at 43 MHz have a correlation coefficient (CC) of 0.60, while those starting at 32 MHz have CC of 0.55. The black circles with arrows indicate that these bursts may be slightly longer in space. Their corresponding bursts drifted outside the dynamic spectra observing range. b) Maximum intensity vs beam velocity, there is almost no correlation here (CC = 0.31), with the only dependency being with the two different sets of bursts, i.e. one set (green points – start frequency of 32 MHz) are less intense and slower than the other.
Current usage metrics show cumulative count of Article Views (full-text article views including HTML views, PDF and ePub downloads, according to the available data) and Abstracts Views on Vision4Press platform.
Data correspond to usage on the plateform after 2015. The current usage metrics is available 48-96 hours after online publication and is updated daily on week days.
Initial download of the metrics may take a while.