Fig. 7
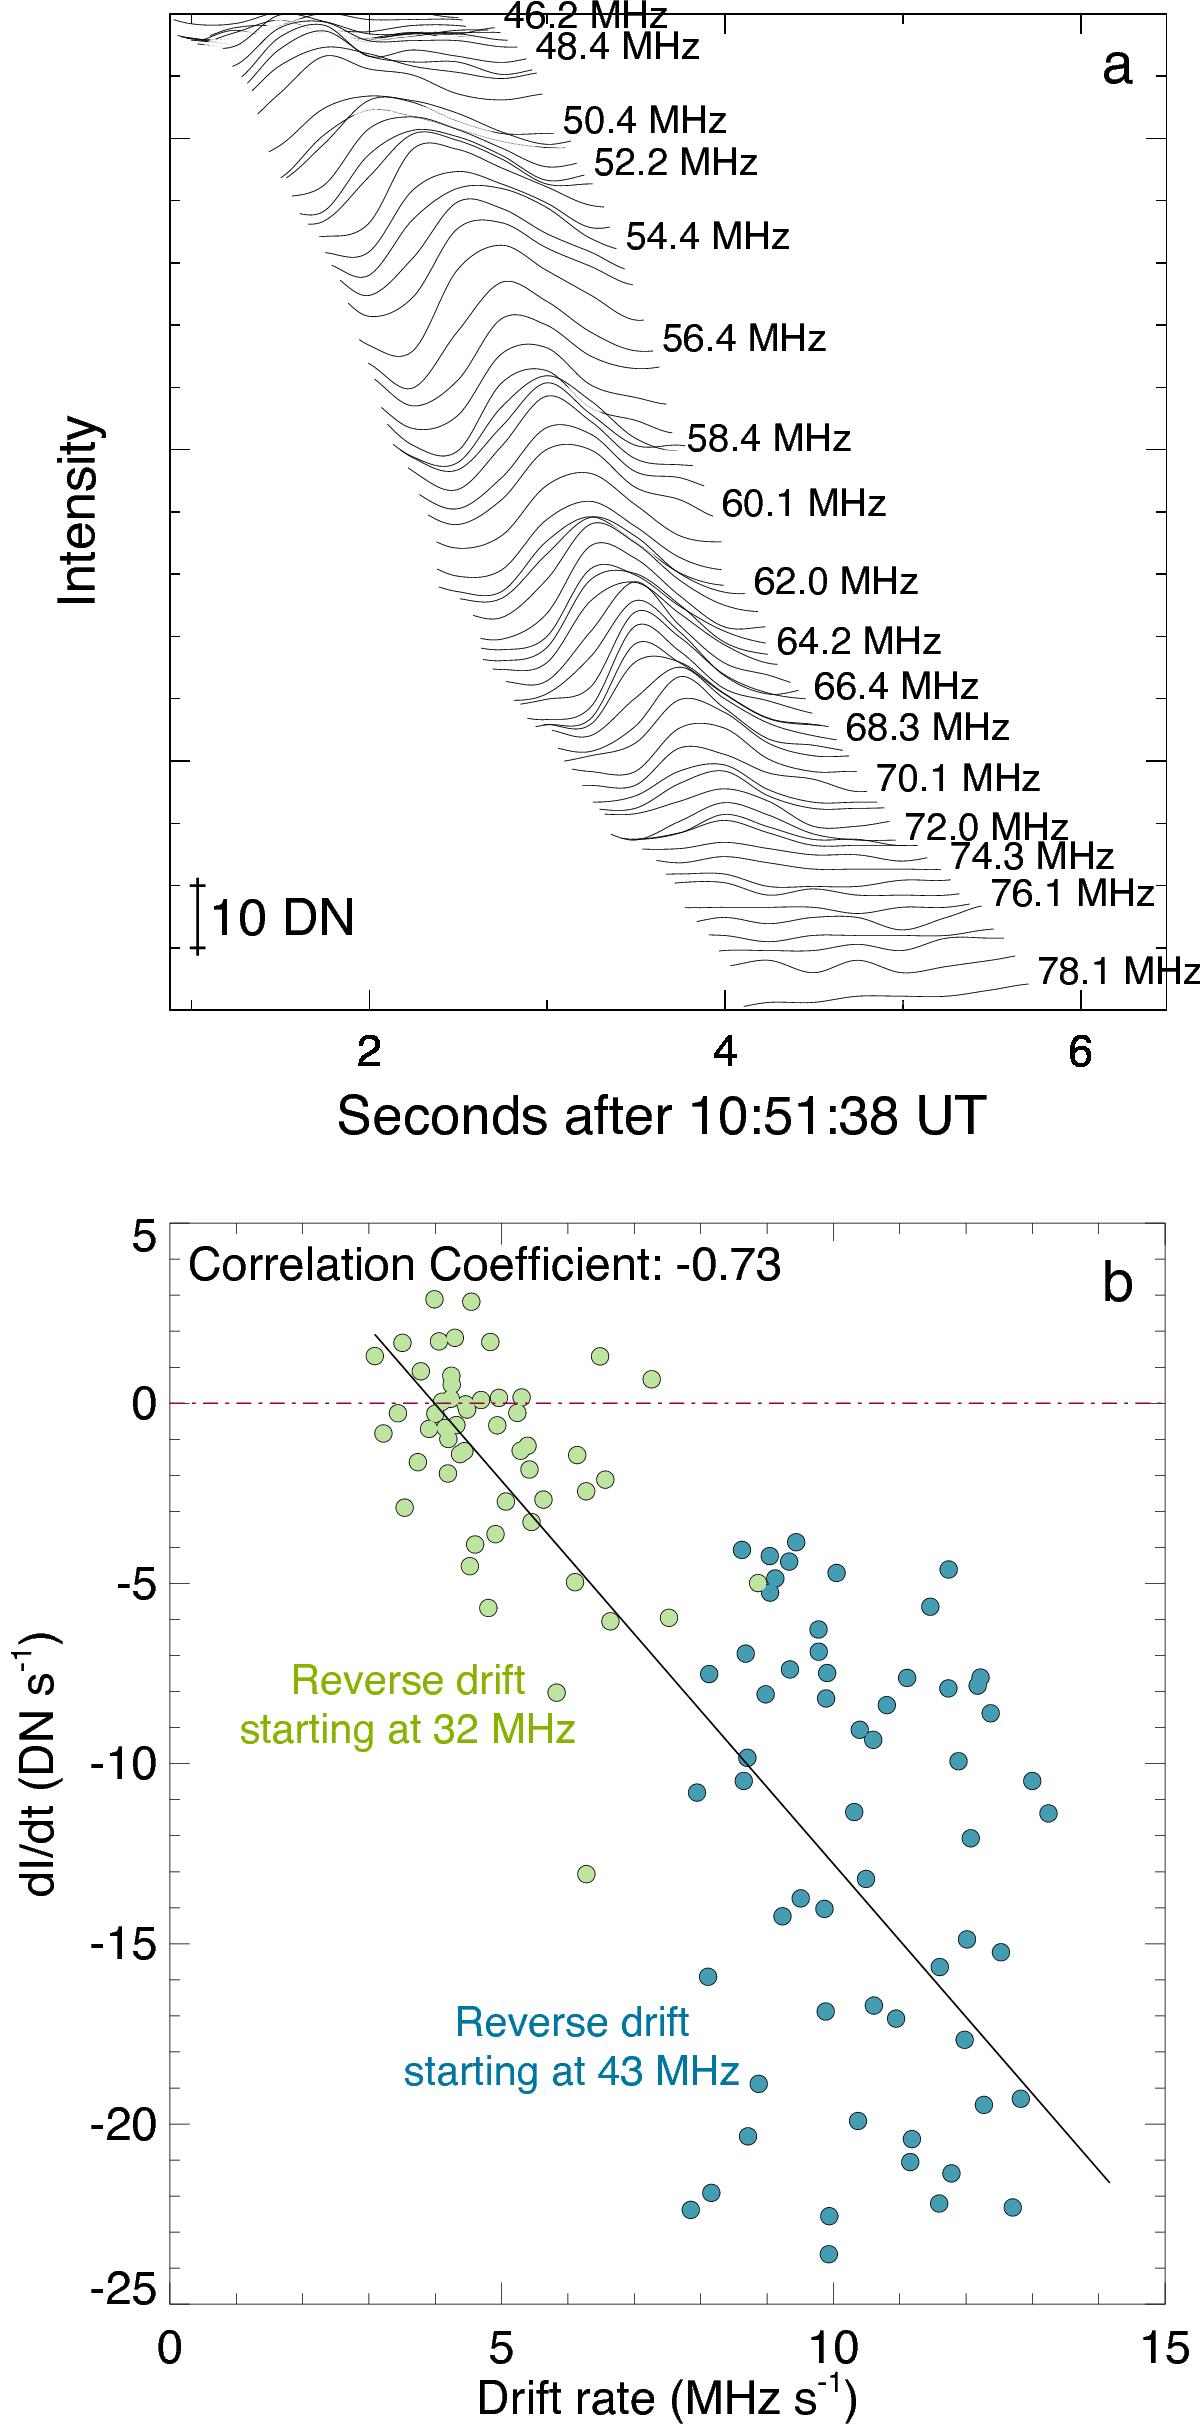
a) Example of a single herringbone burst intensity at each frequency. The burst is most intense at its start and decreases in intensity as it drifts to higher frequencies, i.e. decreases in intensity over its lifetime. b) Scatter plot of burst drift rate vs the rate of decrease in intensity along the burst for the reverse drift bursts only. The receiving system is uncalibrated, so the intensity are simply quoted in data numbers (DNs). The green points are the reverse drift bursts starting at 32 MHz (R32), while the blue points are reverse drift bursts starting at 43 MHz (R43). We note that the R32 have a lower drift and rate of change of intensity than the R43 bursts. Overall, a clear negative correlation is shown here; this occurs because the majority of the bursts decrease in intensity over their lifetime, i.e. the slope of the black line is (dI/ dt) = m(df/ dt) ⇒ m = dI/ dt × dt/ df = dI/ df. This is the opposite of type III bursts, which generally show an increase in intensity over their lifetime.
Current usage metrics show cumulative count of Article Views (full-text article views including HTML views, PDF and ePub downloads, according to the available data) and Abstracts Views on Vision4Press platform.
Data correspond to usage on the plateform after 2015. The current usage metrics is available 48-96 hours after online publication and is updated daily on week days.
Initial download of the metrics may take a while.