Fig. 5
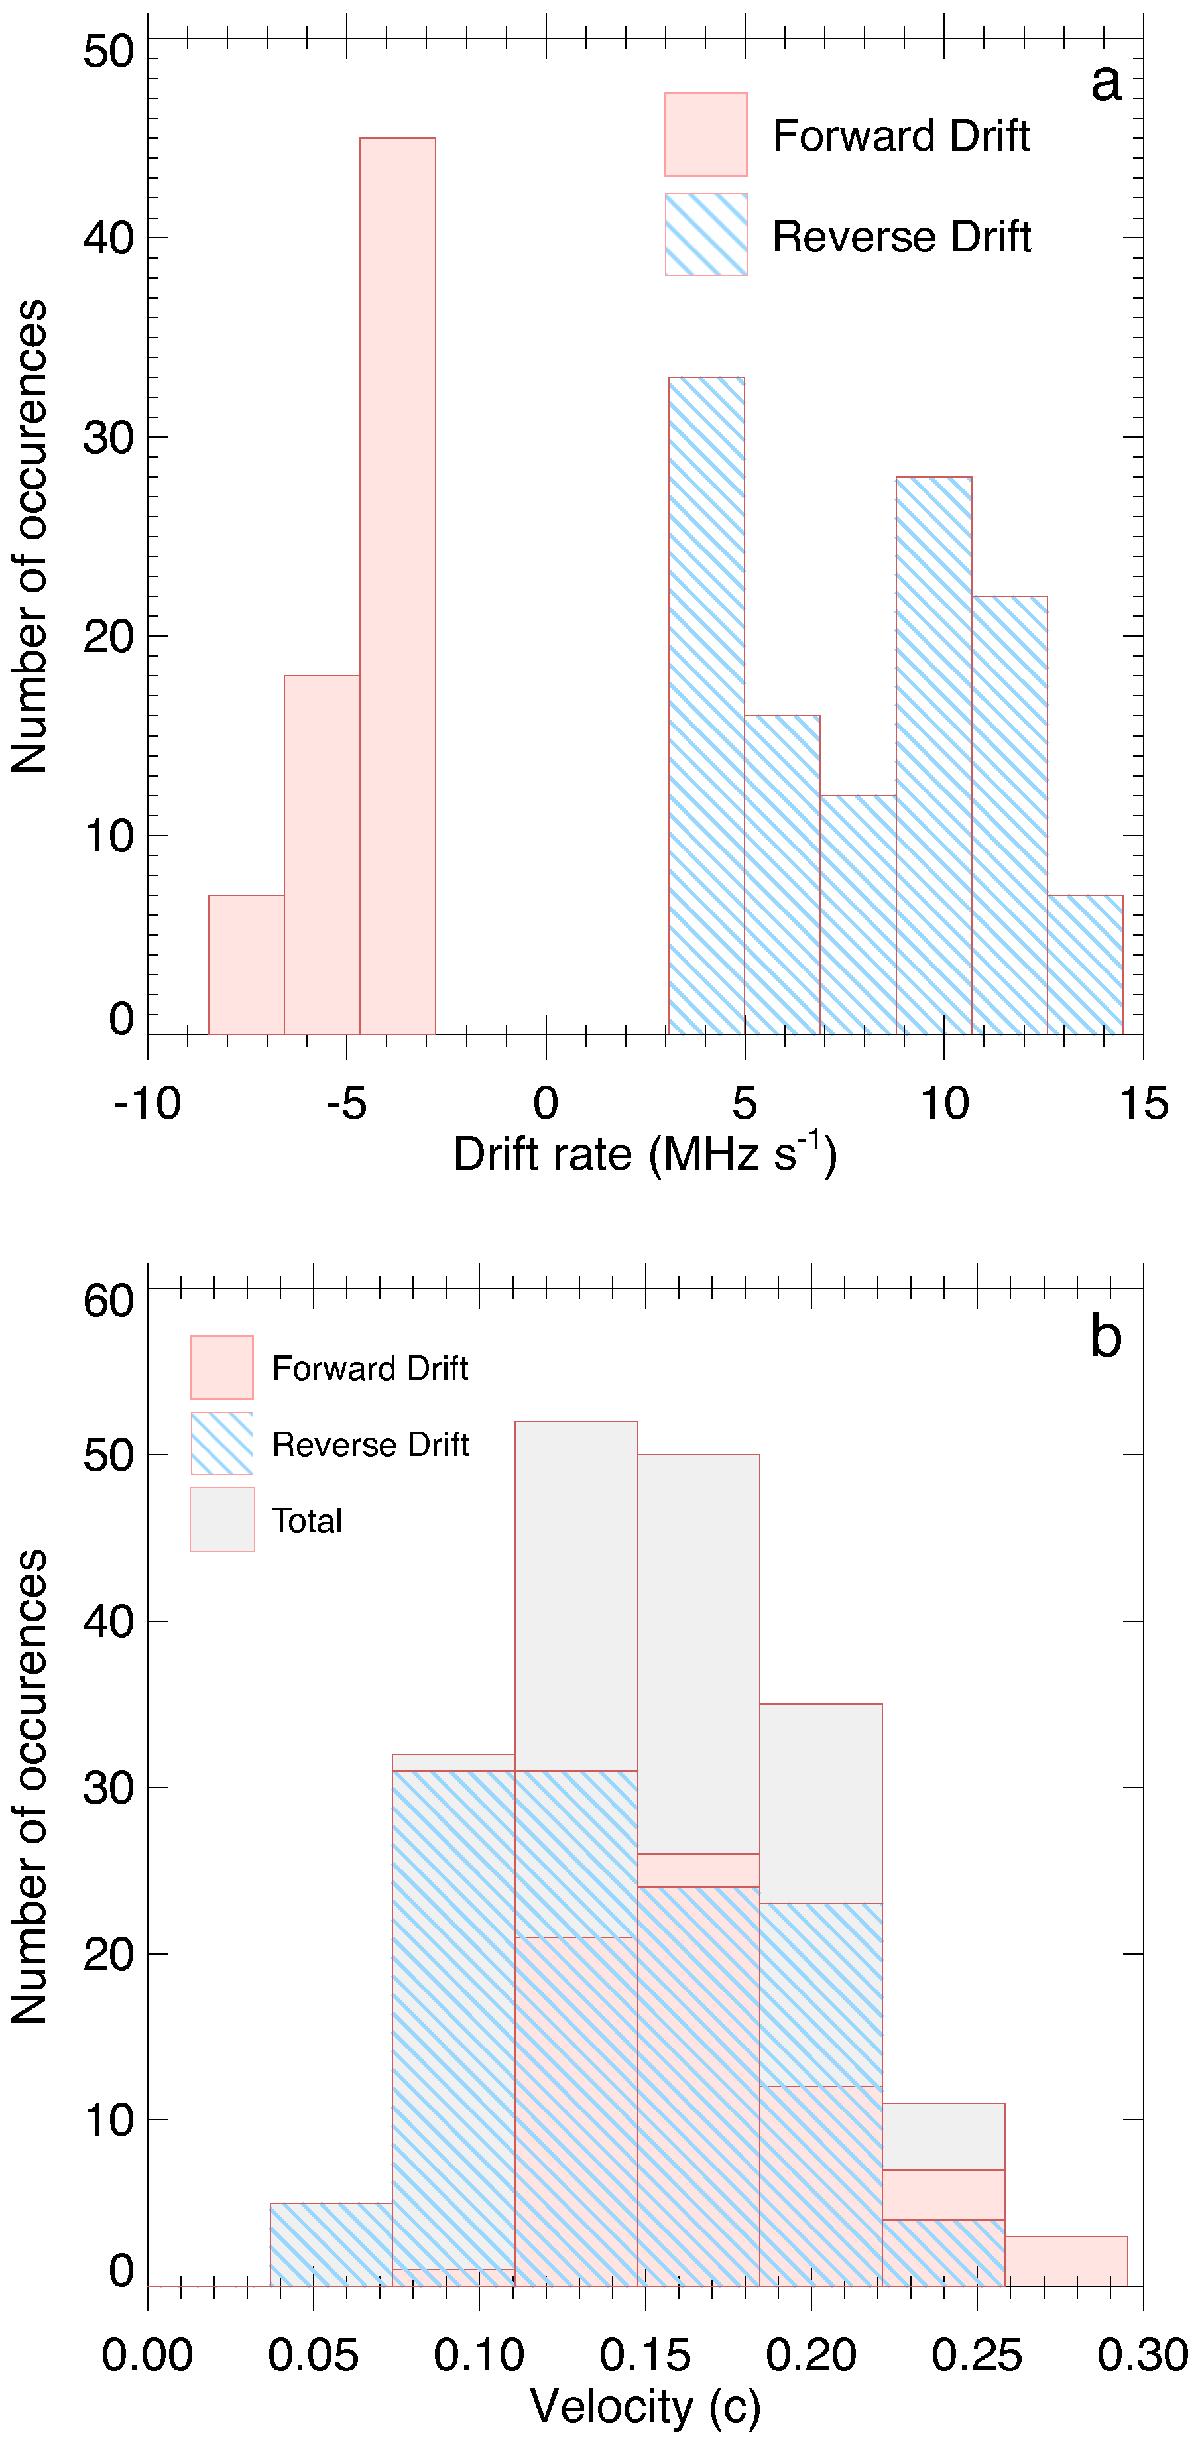
a) Histogram of drift rates of reverse drift (blue stripes) and forward drift (red) bursts. The reverse drift bursts have a bimodal distribution. Those with a generally higher drift rate (above 10 MHz s-1) are the reverse drifting bursts that start at 43 MHz. Taking the absolute value of these drifts and using a TCD density model we produce a histogram of velocities for the electron beams causing the herringbones b), with an mean of 0.16 c. We note that although the drift histogram is bimodal, the velocity histogram is not. This is due to electron beams of a single velocity distribution propagating in different heights of the atmosphere. A different height means a different density gradient and hence a different drift rate.
Current usage metrics show cumulative count of Article Views (full-text article views including HTML views, PDF and ePub downloads, according to the available data) and Abstracts Views on Vision4Press platform.
Data correspond to usage on the plateform after 2015. The current usage metrics is available 48-96 hours after online publication and is updated daily on week days.
Initial download of the metrics may take a while.