Fig. 4

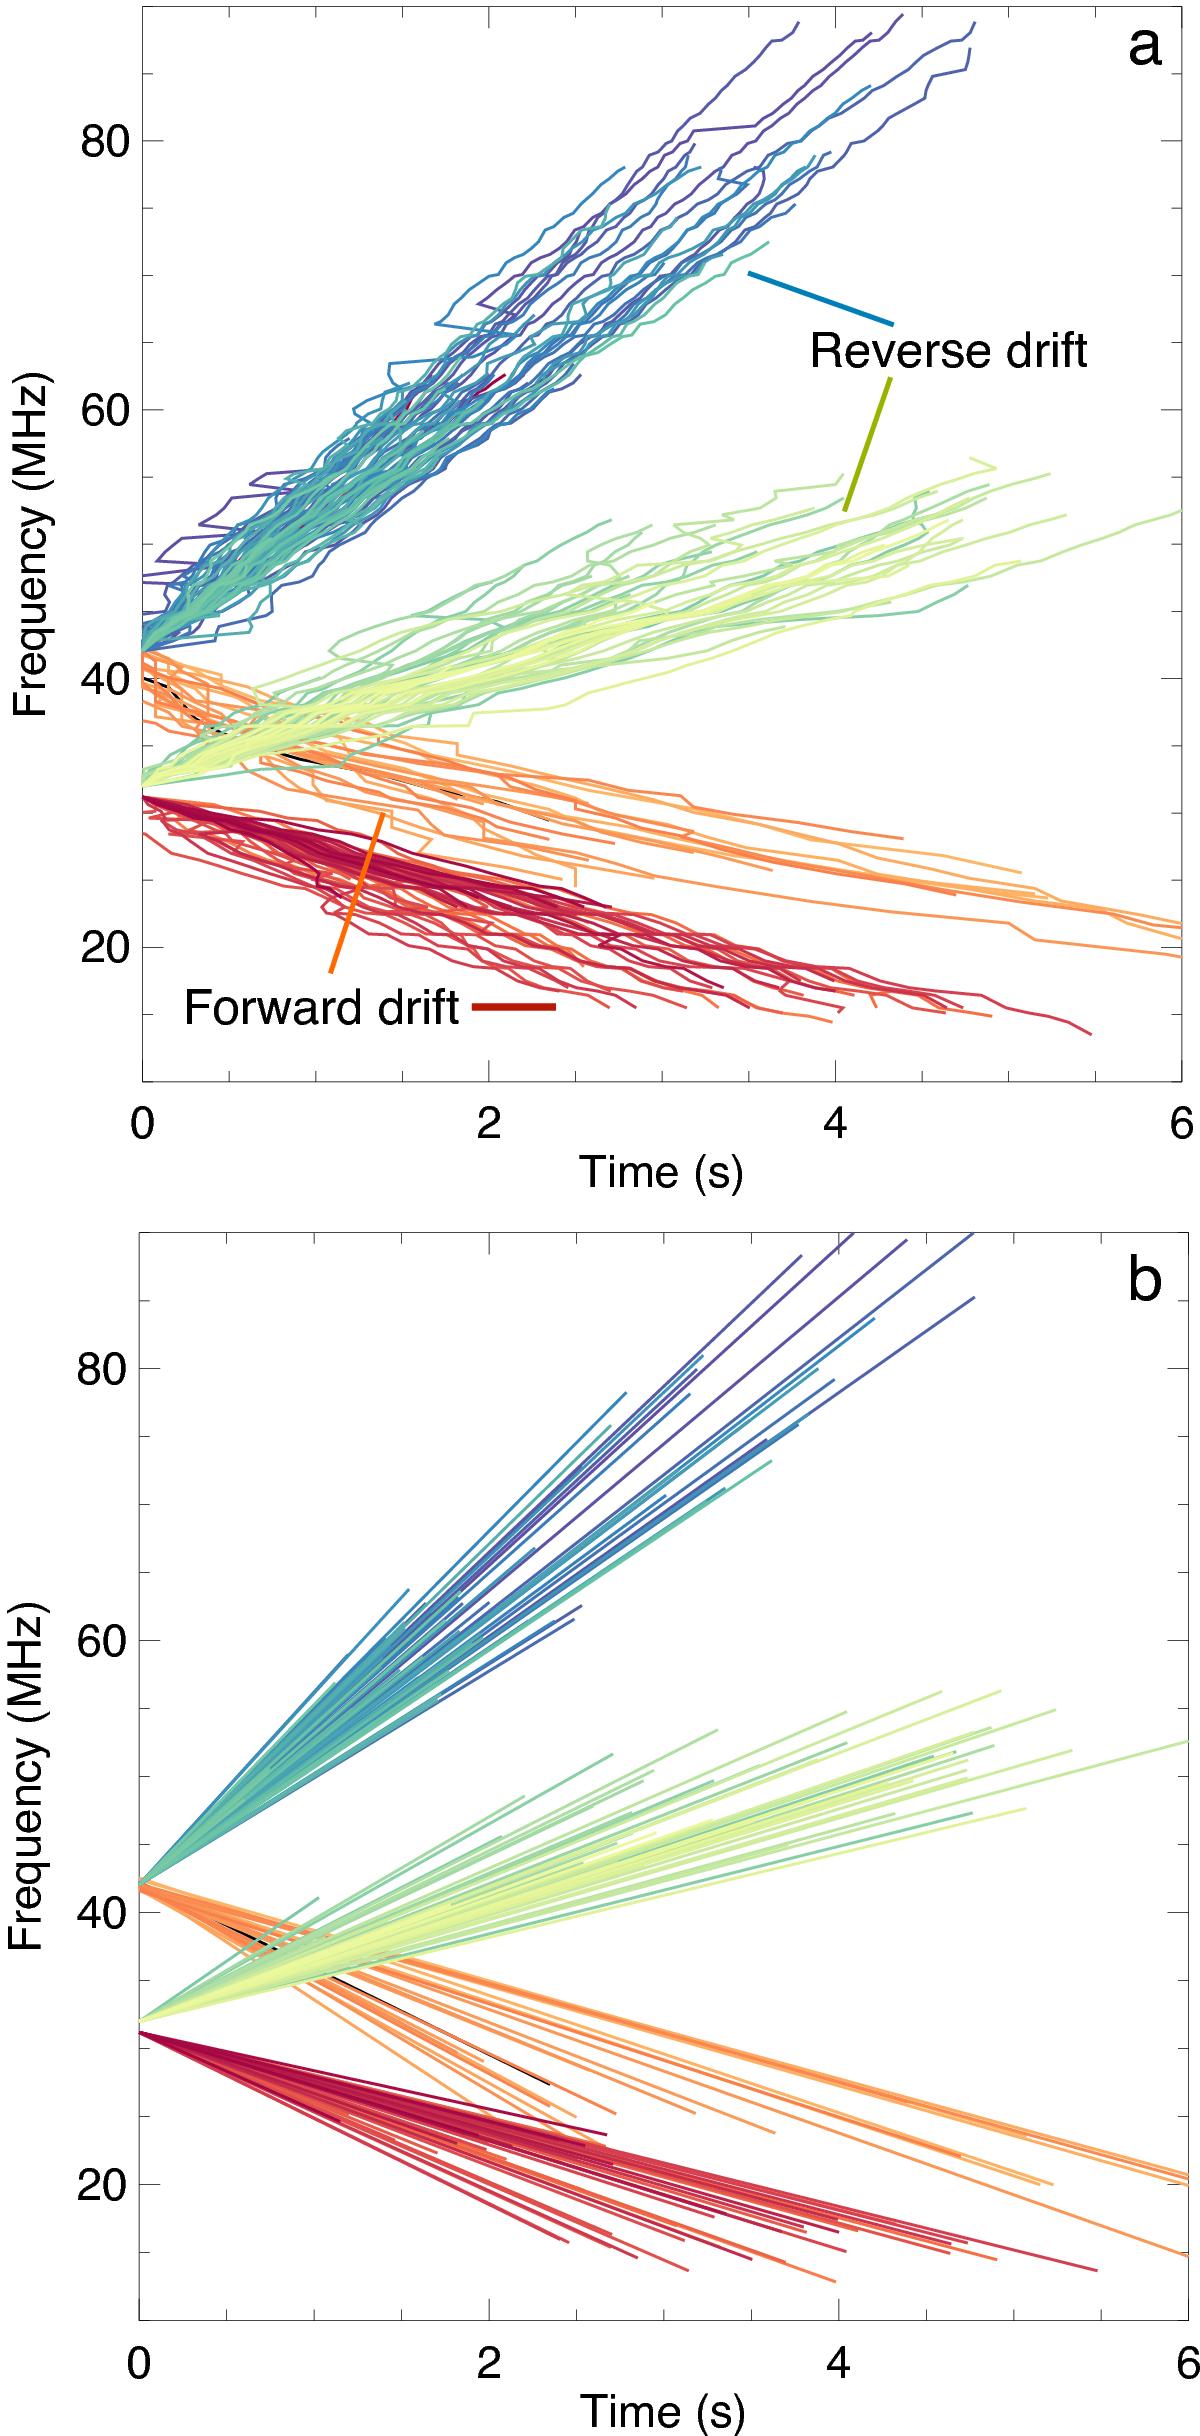
a) Frequency vs. time data points for all detected bursts for both reverse (blue-green) and forward drifting bursts (orange-red). One line represents one burst, with 188 in total. b) Linear fits to each burst detection. The green-red lines originate from ~32 MHz and are detections of the first set of bursts between 10:47:30–10:50:30 UT. The blue-orange lines are the second set of bursts originating from ~43 MHz between 10:50:20–10:53:00 UT. There are not equal numbers of positive and reverse drift bursts, indicating there is not a one-to-one correspondence of particle beams travelling toward and away from the Sun, i.e. beams are bi-directional but not always in reverse and forward drift partners.
Current usage metrics show cumulative count of Article Views (full-text article views including HTML views, PDF and ePub downloads, according to the available data) and Abstracts Views on Vision4Press platform.
Data correspond to usage on the plateform after 2015. The current usage metrics is available 48-96 hours after online publication and is updated daily on week days.
Initial download of the metrics may take a while.


