Fig. 3
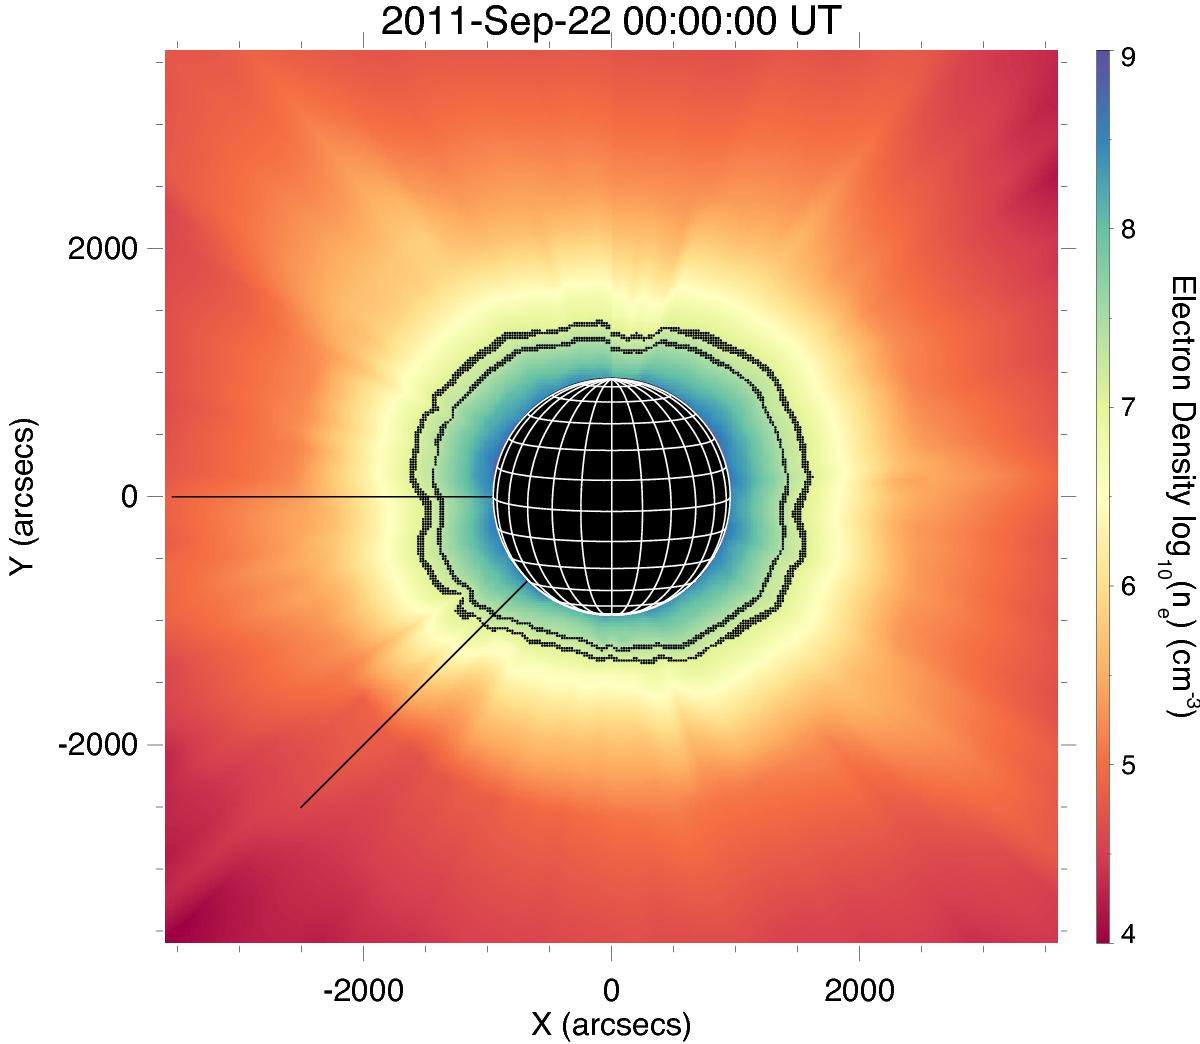
Electron density map of the solar corona produced from AIA and LASCO C2 observations (Zucca et al. 2014). A density profile of the corona for the data of the event was produced by averaging the density as a function of radius between the lines at position angles of 90° and 135°. This density as a function of radius was used in deriving electron beam kinematics from the herringbone radio burst statistics. The inner and outer black points represent the heights at which 43 MHz (0.47 R⊙) and 32 MHz (0.59 R⊙) are expected to occur.
Current usage metrics show cumulative count of Article Views (full-text article views including HTML views, PDF and ePub downloads, according to the available data) and Abstracts Views on Vision4Press platform.
Data correspond to usage on the plateform after 2015. The current usage metrics is available 48-96 hours after online publication and is updated daily on week days.
Initial download of the metrics may take a while.