Fig. 1
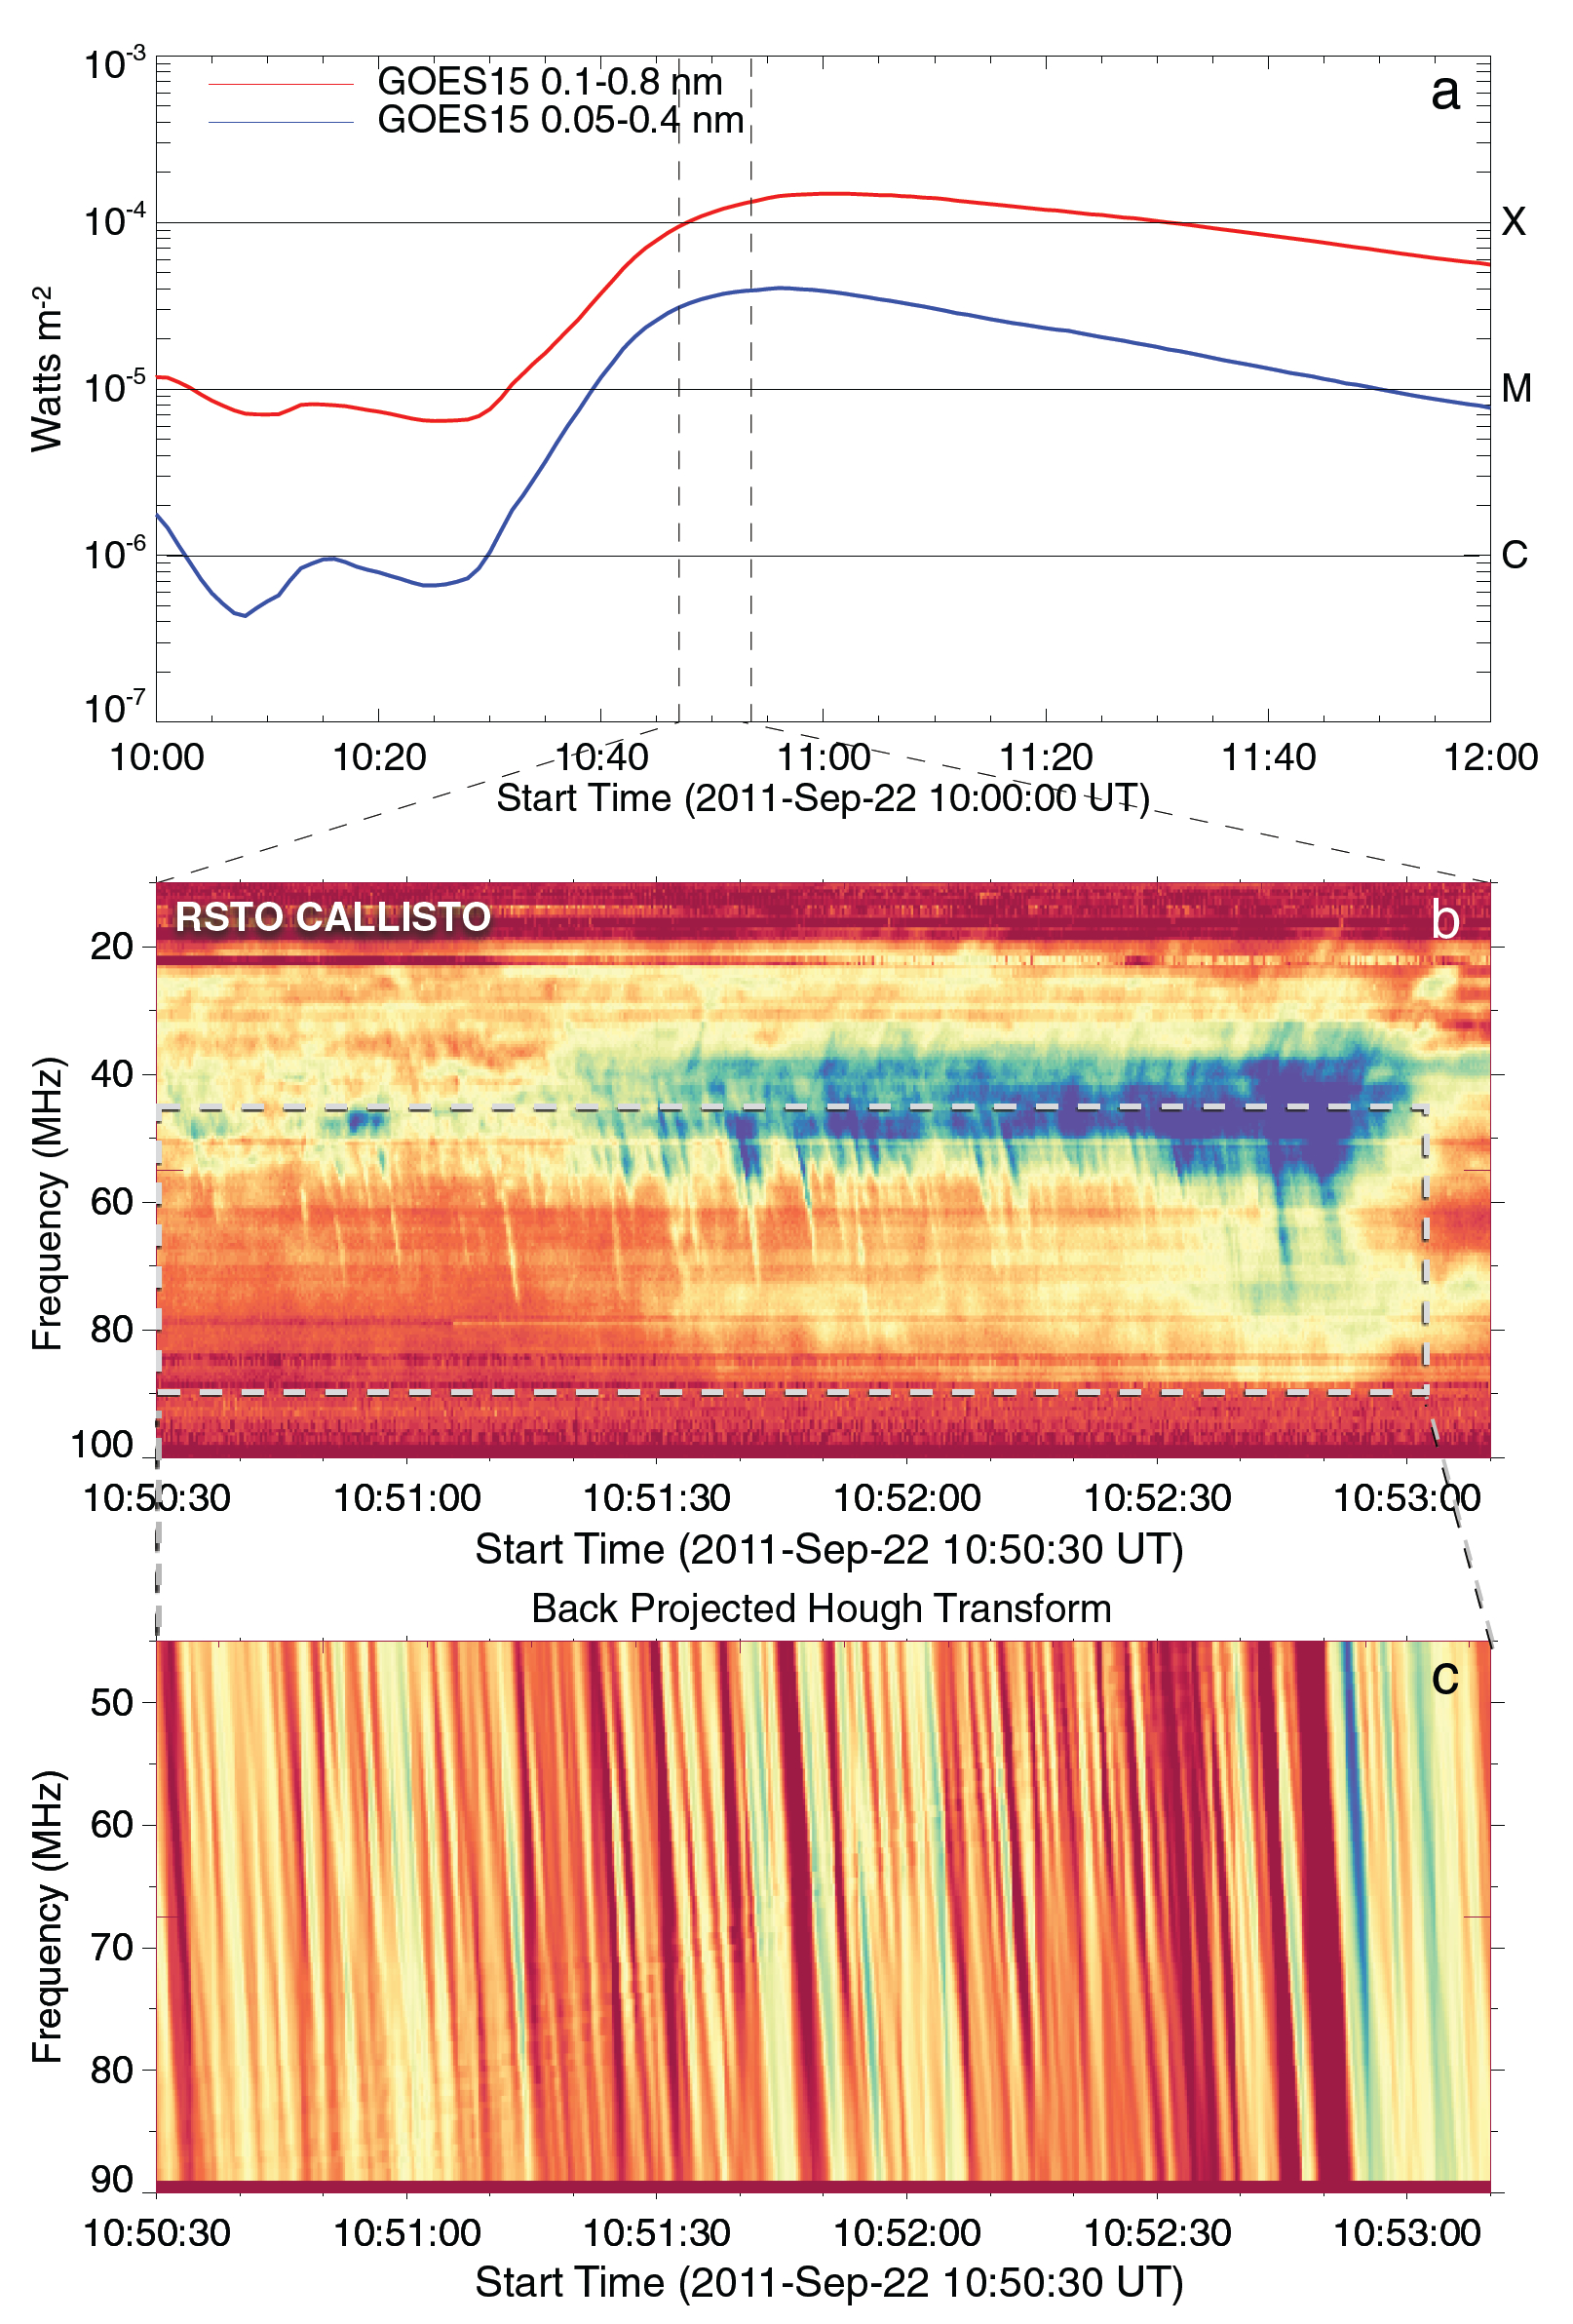
a) GOES soft X-ray light curves showing an X1.4 class flare on 22 September 2011 at ~10:30 UT. b) During the impulsive/peak phase of the flare the RSTO 10–100 MHz Callisto receiver observed herringbone radio bursts from ~10:48–10:55 UT; only a section of all herringbone activity is shown here for clarity. c) The back projected Hough transform of the area containing the reverse drift bursts. This data contains positions of all bursts, which are much more clearly defined and subject to less RFI or background noise. We note that the Hough transform provides the positions of burst maxima but does not produce the stop frequency in the dynamic spectra. For our analysis the stopping frequency was chosen manually. For a complete overview of all radio activity from this event, see Carley et al. (2013).
Current usage metrics show cumulative count of Article Views (full-text article views including HTML views, PDF and ePub downloads, according to the available data) and Abstracts Views on Vision4Press platform.
Data correspond to usage on the plateform after 2015. The current usage metrics is available 48-96 hours after online publication and is updated daily on week days.
Initial download of the metrics may take a while.