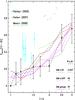
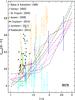
Fig. 3
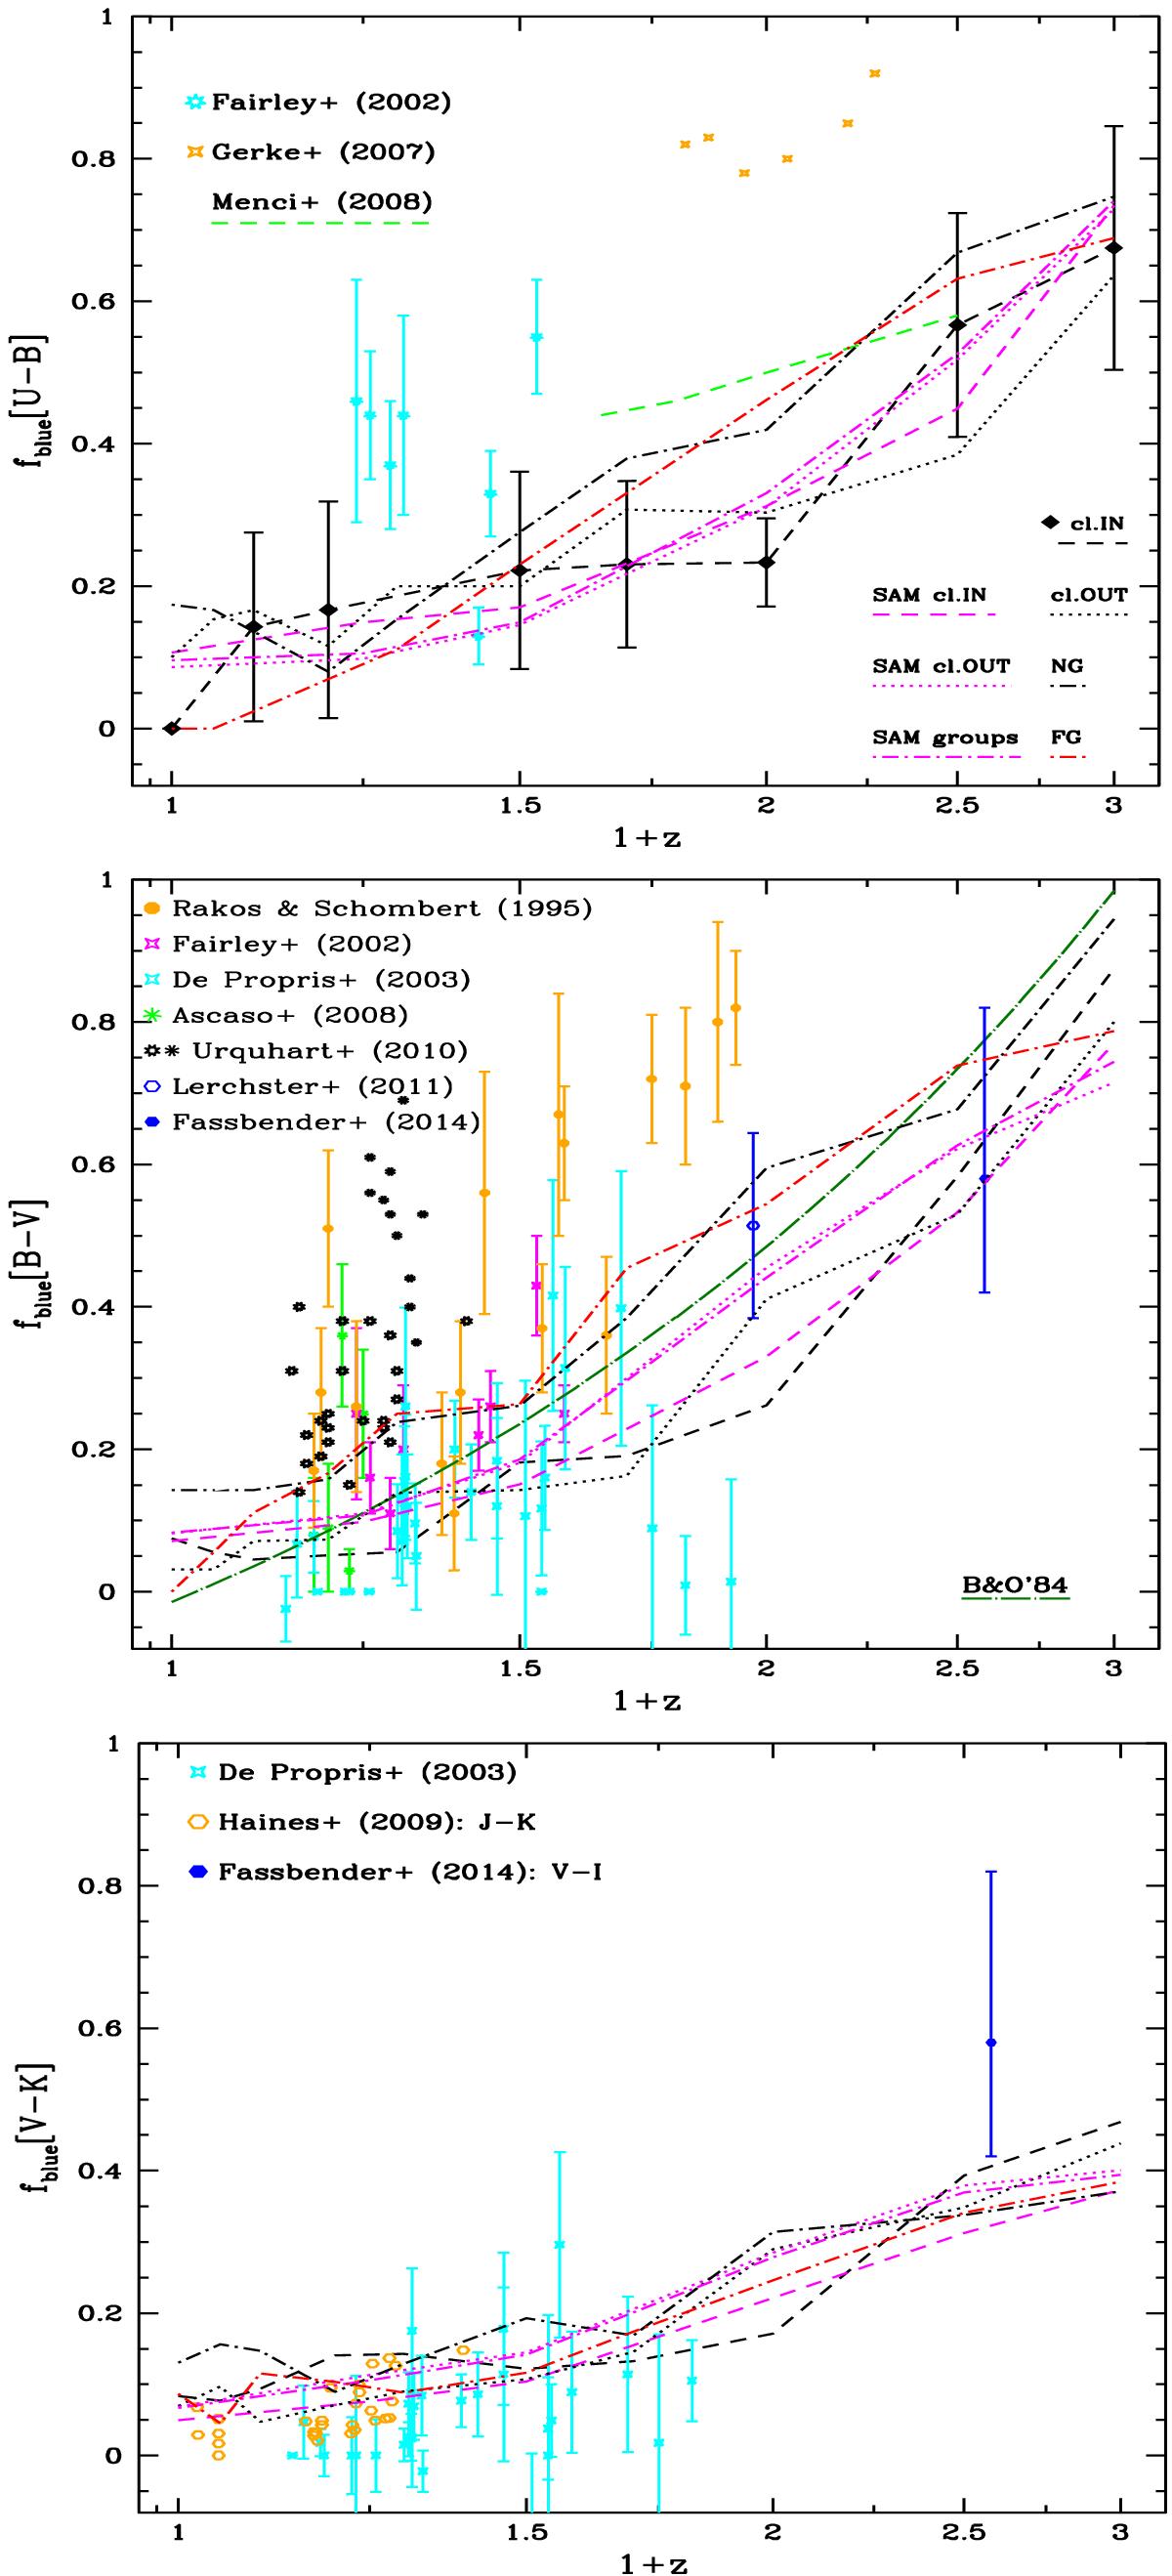
Fraction of blue galaxies as computed in different colours, based on the DS definition from Fig. 1 and colour–colour selection from Fig. 2. It is compared with observational data and with the original Butcher-Oemler curve in B − V, extrapolated to high z as fbl = (z/ 2) − 0.015 (mid panel, dot-long-dashed line). The lower limit for selecting samples is given in terms of redshift-variable absolute MB,MV and MK magnitudes (see text for details). The Poissonian error on fbl is given by σ2(fbl) = Nbl(N − Nbl) /N3 (see De Propris et al. 2004) and shown only for SIM cluster cores in the U − B plot as reference (upper panel).
Current usage metrics show cumulative count of Article Views (full-text article views including HTML views, PDF and ePub downloads, according to the available data) and Abstracts Views on Vision4Press platform.
Data correspond to usage on the plateform after 2015. The current usage metrics is available 48-96 hours after online publication and is updated daily on week days.
Initial download of the metrics may take a while.