Free Access
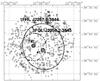
Fig. 2
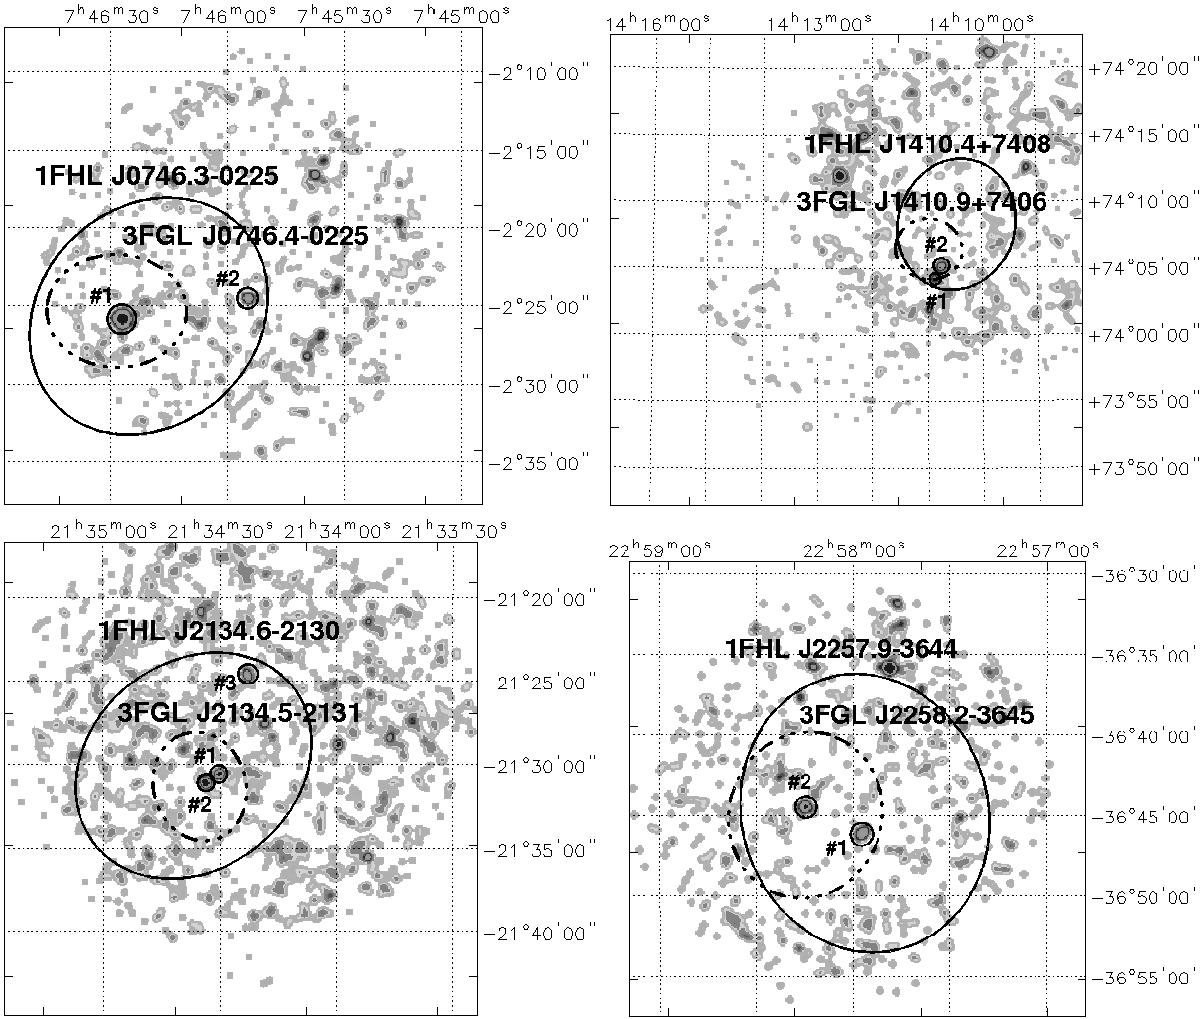
XRT 0.3–10 keV images of high-energy Fermi sources for which more than one X-ray detection is found. Black circles depict the location of each XRT detection. Black ellipse and black-dashed-dotted ellipse depict the positional uncertainty of the 1FHL and 3FGL sources, respectively.
This figure is made of several images, please see below:
Current usage metrics show cumulative count of Article Views (full-text article views including HTML views, PDF and ePub downloads, according to the available data) and Abstracts Views on Vision4Press platform.
Data correspond to usage on the plateform after 2015. The current usage metrics is available 48-96 hours after online publication and is updated daily on week days.
Initial download of the metrics may take a while.