Fig. 9
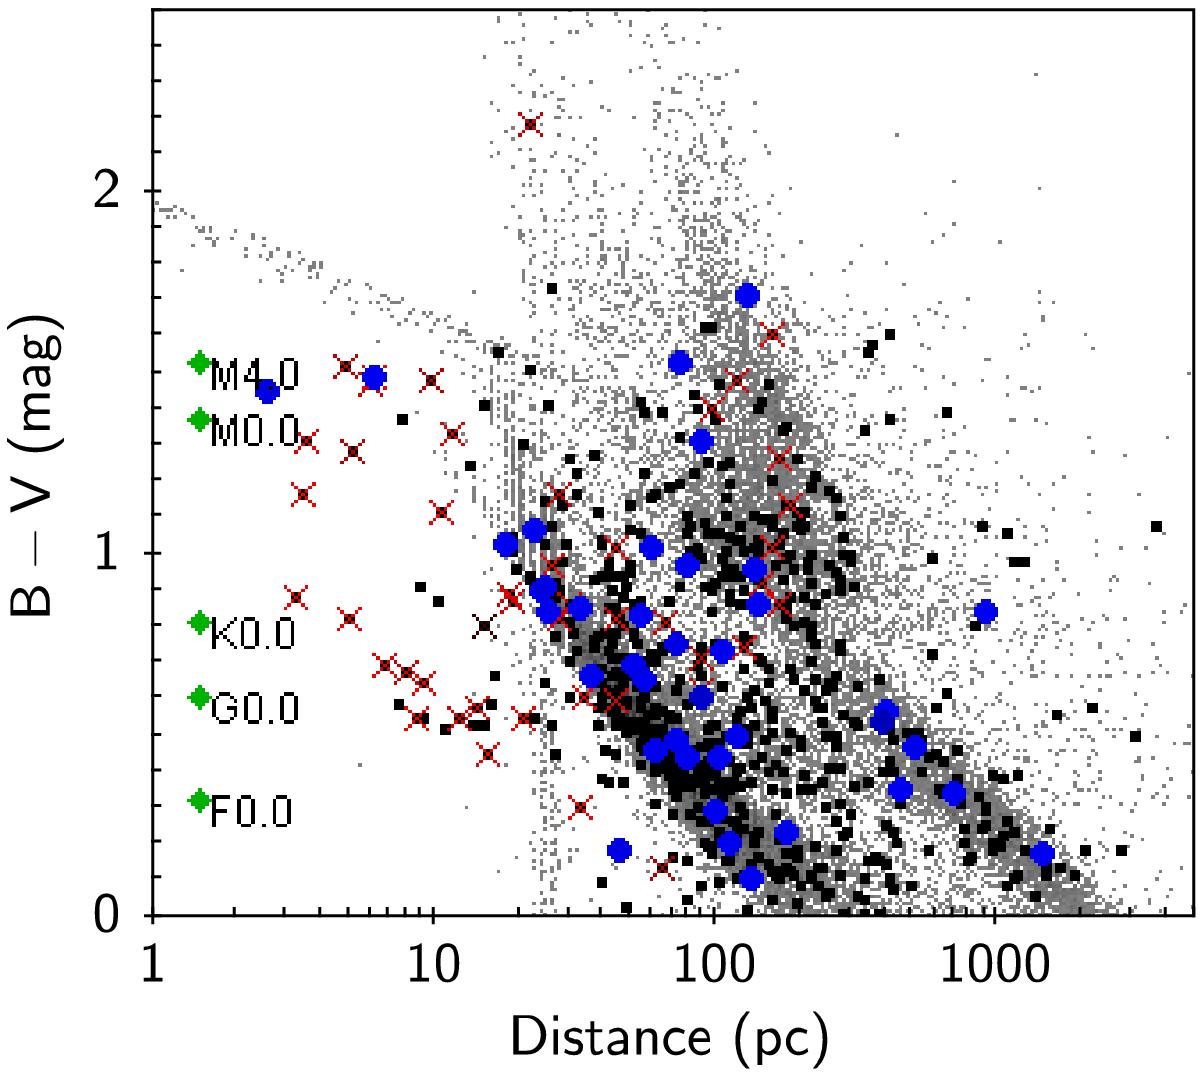
Stellar distance (pc) versus colour (B − V, as an indicator of spectral type). Key to symbols: blue filled circles: Serendipitously-observed stars in the CVS sample; red diagonal crosses: Target stars in the CVS sample; black dots: all Tycho stars with 2XMM light-curves; grey dots: all Tycho stars falling in 2XMM fields (without regard to 2XMM detection). For the last two classes, some points lie outside the plot and are therefore omitted, in order to improve visibility of the main distribution.
Current usage metrics show cumulative count of Article Views (full-text article views including HTML views, PDF and ePub downloads, according to the available data) and Abstracts Views on Vision4Press platform.
Data correspond to usage on the plateform after 2015. The current usage metrics is available 48-96 hours after online publication and is updated daily on week days.
Initial download of the metrics may take a while.