Free Access
Fig. 6
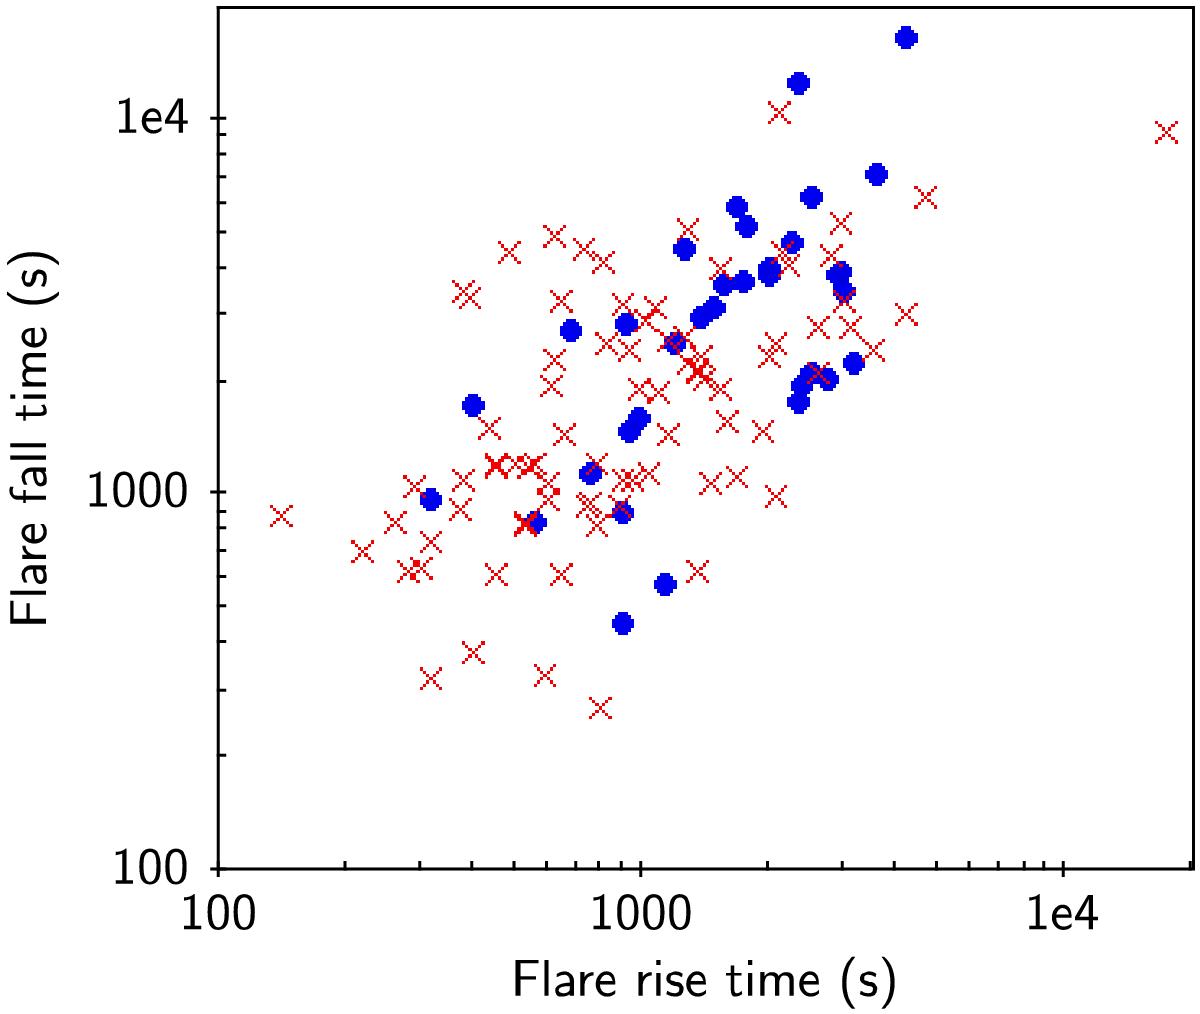
Flare fall-time versus rise-time. Only “fully-observed” flares are shown (see text for details). Key to symbols: blue circles: Serendipitously-observed stars in the CVS sample; red diagonal crosses: Target stars in the CVS sample.
Current usage metrics show cumulative count of Article Views (full-text article views including HTML views, PDF and ePub downloads, according to the available data) and Abstracts Views on Vision4Press platform.
Data correspond to usage on the plateform after 2015. The current usage metrics is available 48-96 hours after online publication and is updated daily on week days.
Initial download of the metrics may take a while.