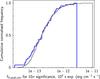
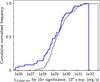
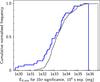
Fig. 24
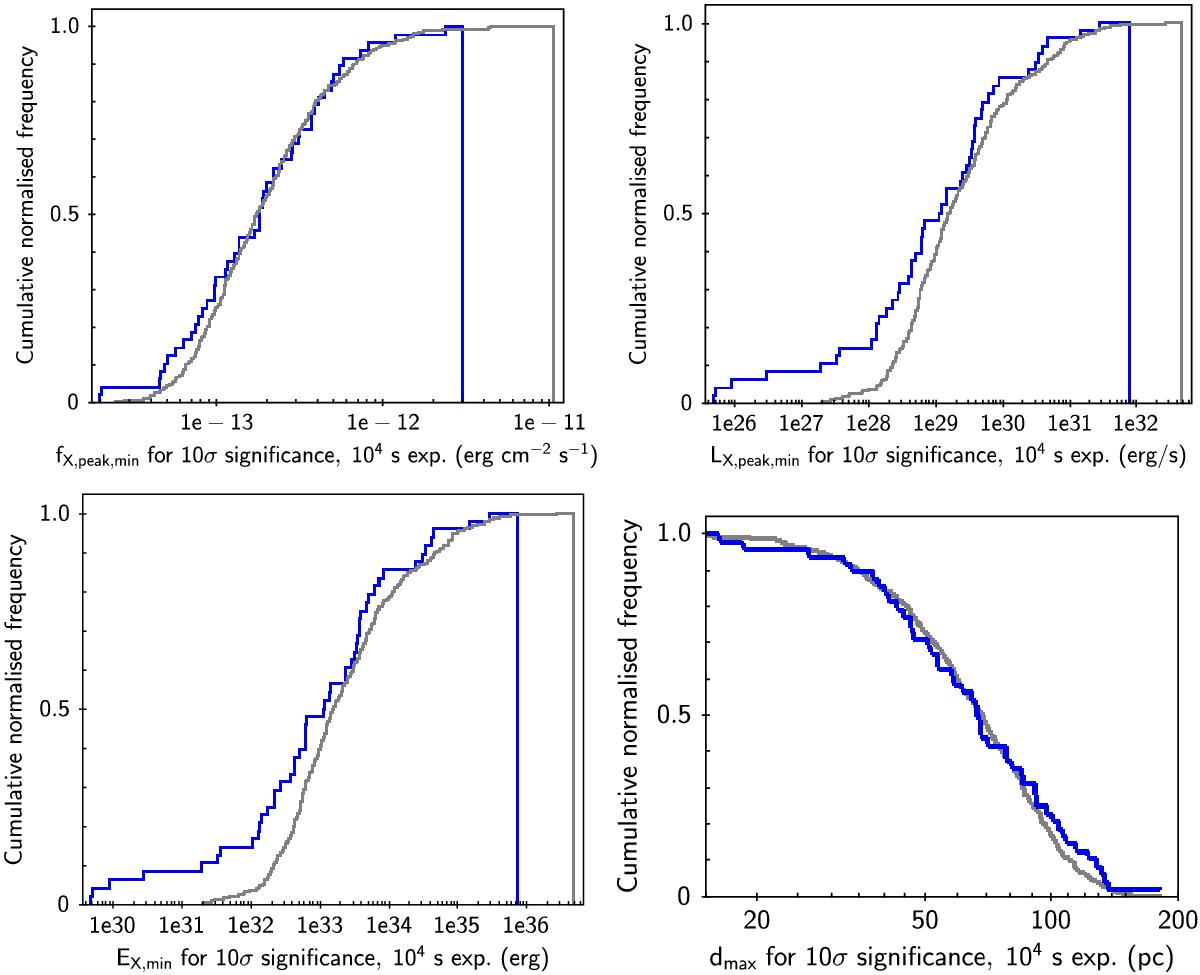
From top left, across: a) survey completeness or “coverage” C, in terms of the fraction of the survey (or specific samples) in which a flare with peak X-ray flux, >fX,peak,min(erg cm-2 s-1) could be detected, for a flare S:N> 10 and a duration of 104 s; fX,peak,min scales as [S:N threshold]/[![]() ]. Key: blue line: serendipitous variable sample (SV); grey line: serendipitous non-variable sample (SNV); the line for all serendipitous stars with time-series is indistinguishable from that for the SNV sample. b) As a), but for peak X-ray luminosity, >LX,peak,min(erg s-1); LX,peak,min scales as [S:N threshold]/[
]. Key: blue line: serendipitous variable sample (SV); grey line: serendipitous non-variable sample (SNV); the line for all serendipitous stars with time-series is indistinguishable from that for the SNV sample. b) As a), but for peak X-ray luminosity, >LX,peak,min(erg s-1); LX,peak,min scales as [S:N threshold]/[![]() ]. c) As a), but for X-ray emitted energy, >EX,min (erg); EX,min scales as [S:N threshold] × [
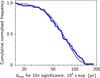
]. c) As a), but for X-ray emitted energy, >EX,min (erg); EX,min scales as [S:N threshold] × [![]() ]. d) As a), but for maximum distance, <dmax (pc) to which a flare with LX,peak> 1029 or EX> 1033 could be detected; dmax scales as
]. d) As a), but for maximum distance, <dmax (pc) to which a flare with LX,peak> 1029 or EX> 1033 could be detected; dmax scales as ![]() or
or ![]() .
.
Current usage metrics show cumulative count of Article Views (full-text article views including HTML views, PDF and ePub downloads, according to the available data) and Abstracts Views on Vision4Press platform.
Data correspond to usage on the plateform after 2015. The current usage metrics is available 48-96 hours after online publication and is updated daily on week days.
Initial download of the metrics may take a while.