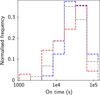
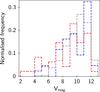
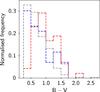
Fig. 23
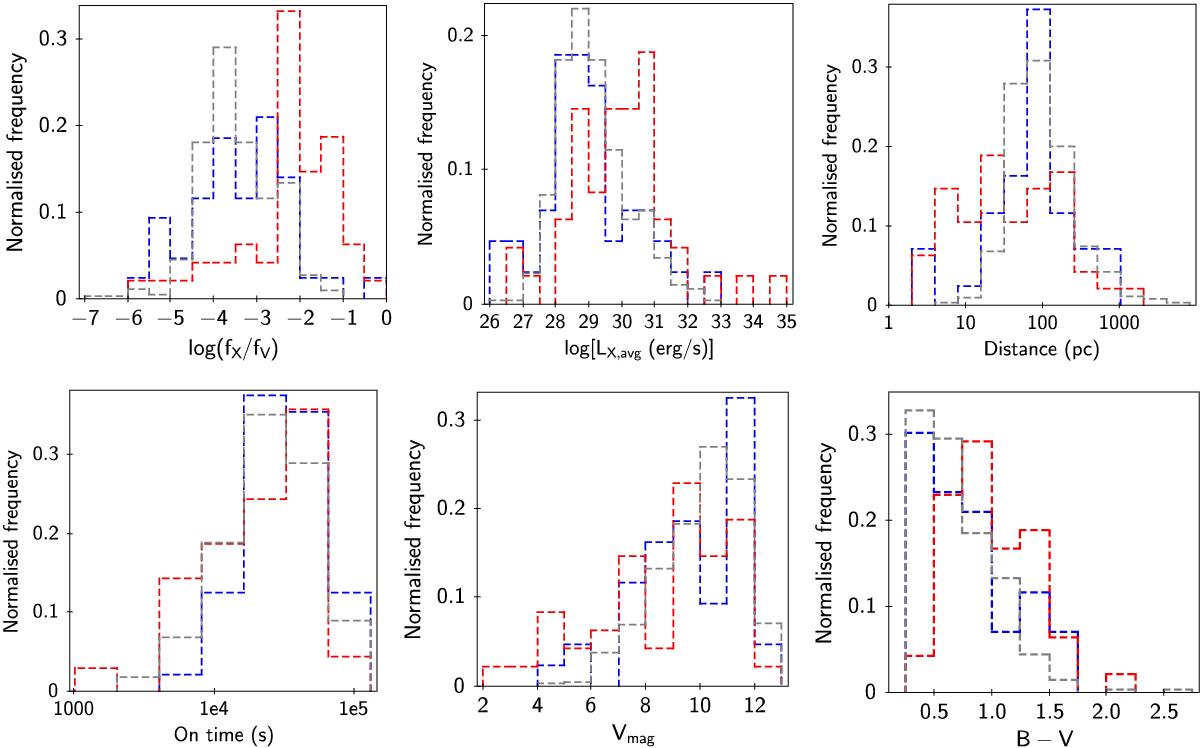
Differential frequency distributions of the serendipitous variable sample (SV, blue lines), the serendipitous non-variable sample (SNV, grey lines) and the target variable sample (TV, red lines), for various properties of the stars and their associated observations. The distributions are normalised to unit area. From top left, across: a) Log [X-ray to visual-band flux ratio, fX/fV]. b) Log [quiescent X-ray luminosity, LX,quies (erg s-1)]. c) Distance (pc). d) On-time (s). e) Visual apparent magnitude, V. f) Colour, B − V. The distributions in d) relate to individual detections (i.e. each DETID was counted once), while the others relate to individual stars (i.e. each SRCID was counted once). a) and b) use values averaged over all 2XMM detections of each source (i.e. derived from 2XMM SC_ parameters).
Current usage metrics show cumulative count of Article Views (full-text article views including HTML views, PDF and ePub downloads, according to the available data) and Abstracts Views on Vision4Press platform.
Data correspond to usage on the plateform after 2015. The current usage metrics is available 48-96 hours after online publication and is updated daily on week days.
Initial download of the metrics may take a while.