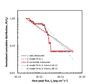
Fig. 19
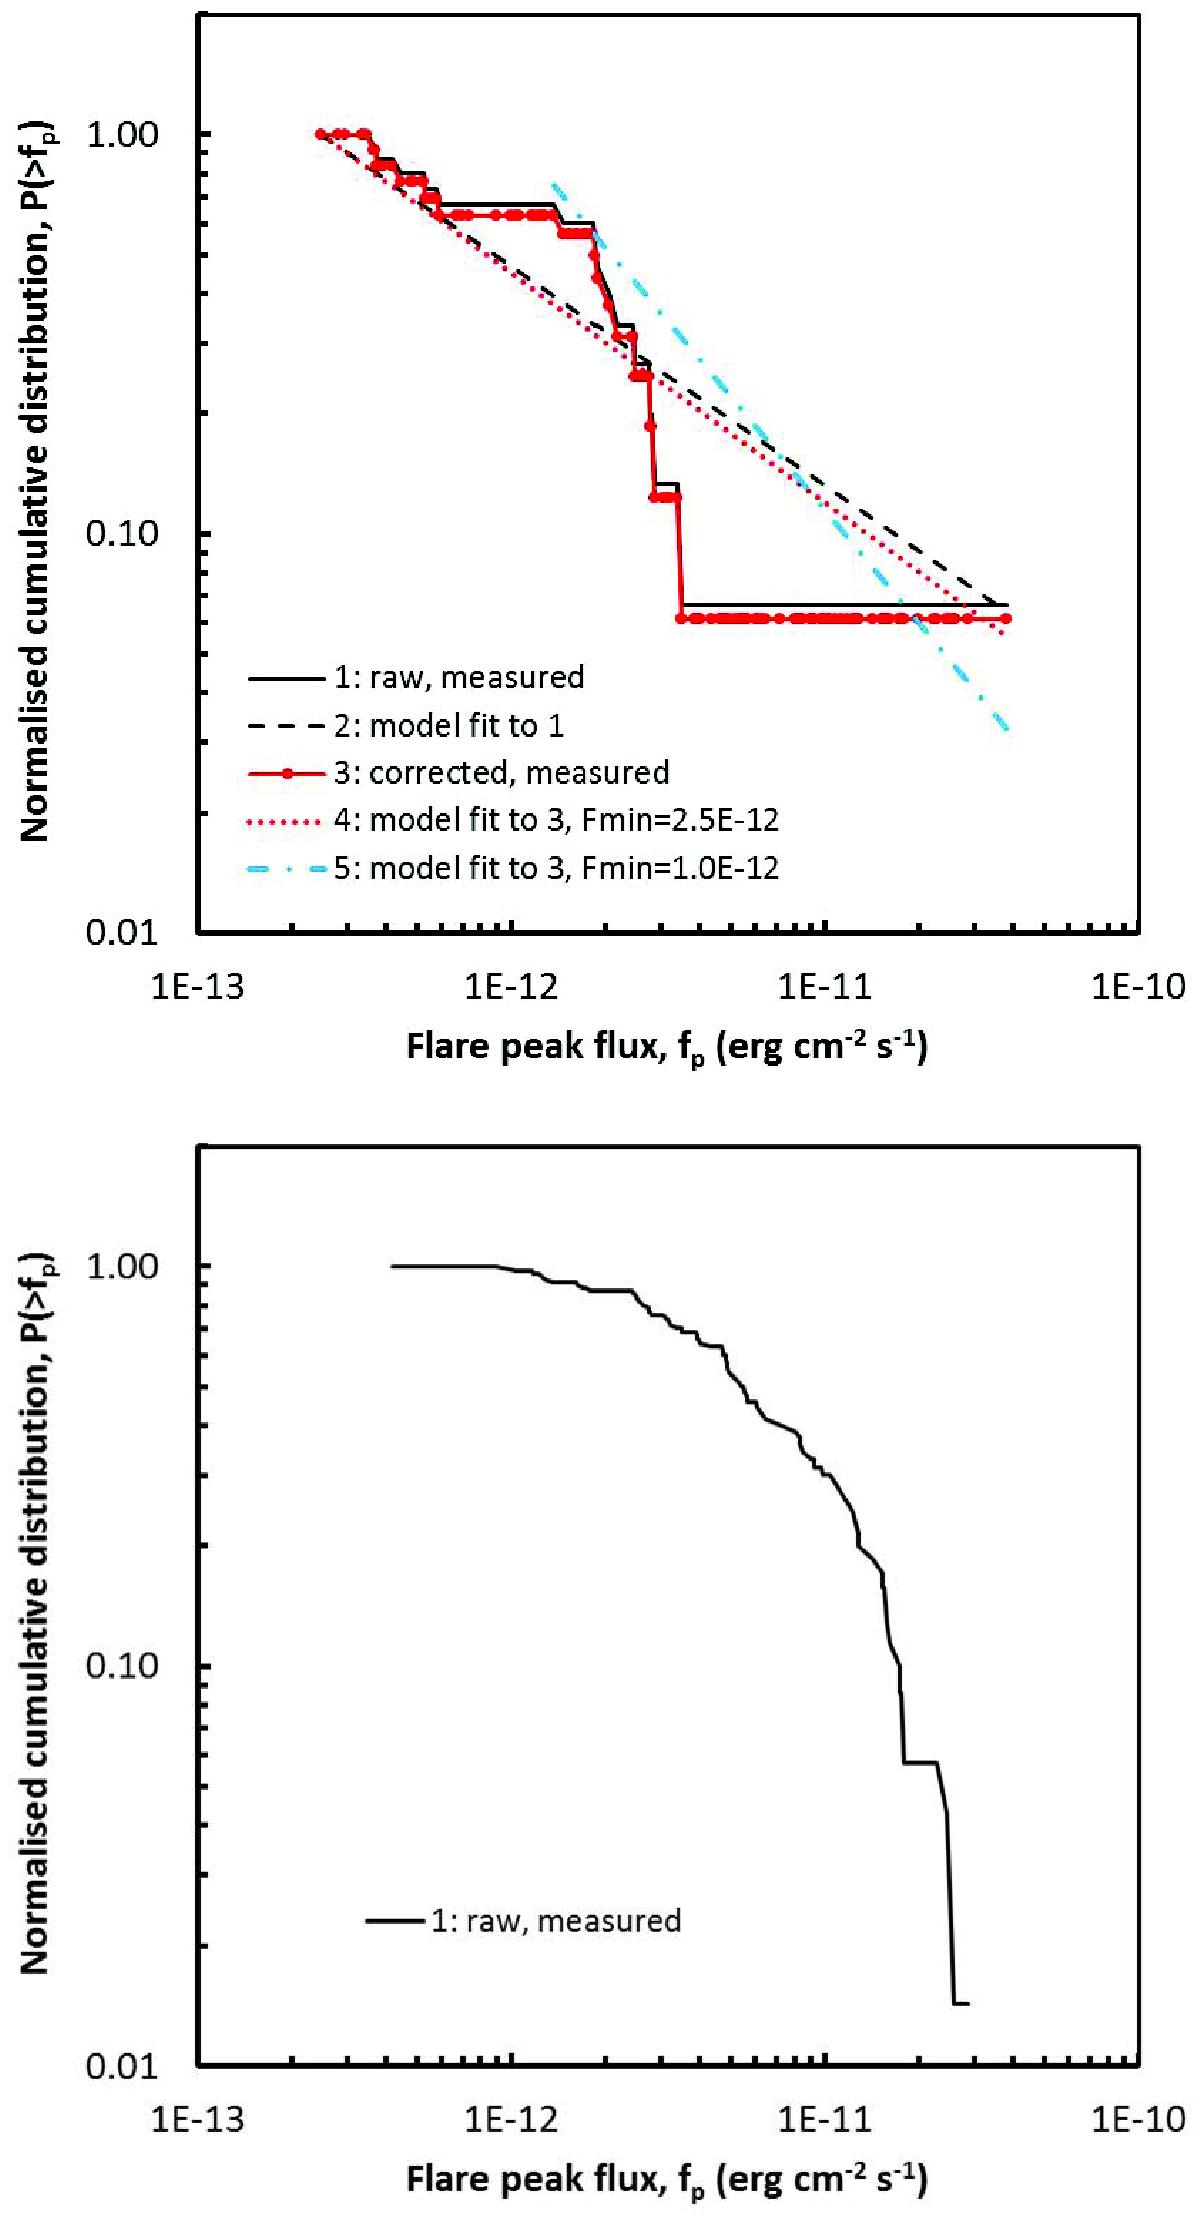
From top: a) Cumulative frequency distribution of flare peak X-ray flux, fX,peak, for the CVS serendipitous-stars sample: black solid line – “raw”, measured distribution; black dashed line – model distribution from ML power-law fit to raw, measured distribution; red solid line with dots – coverage-corrected “measured” distribution; red dotted line – model distribution from ML power-law fit to corrected distribution; blue dash-dot line – model distribution from ML power-law fit to corrected distribution, with higher minimum flux, fX,min. Each model distribution has been derived from the data over the flux range indicated by the model (power-law) line. b) As a), but for the CVS target-stars sample, raw, measured distribution.
Current usage metrics show cumulative count of Article Views (full-text article views including HTML views, PDF and ePub downloads, according to the available data) and Abstracts Views on Vision4Press platform.
Data correspond to usage on the plateform after 2015. The current usage metrics is available 48-96 hours after online publication and is updated daily on week days.
Initial download of the metrics may take a while.