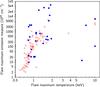
Fig. 18
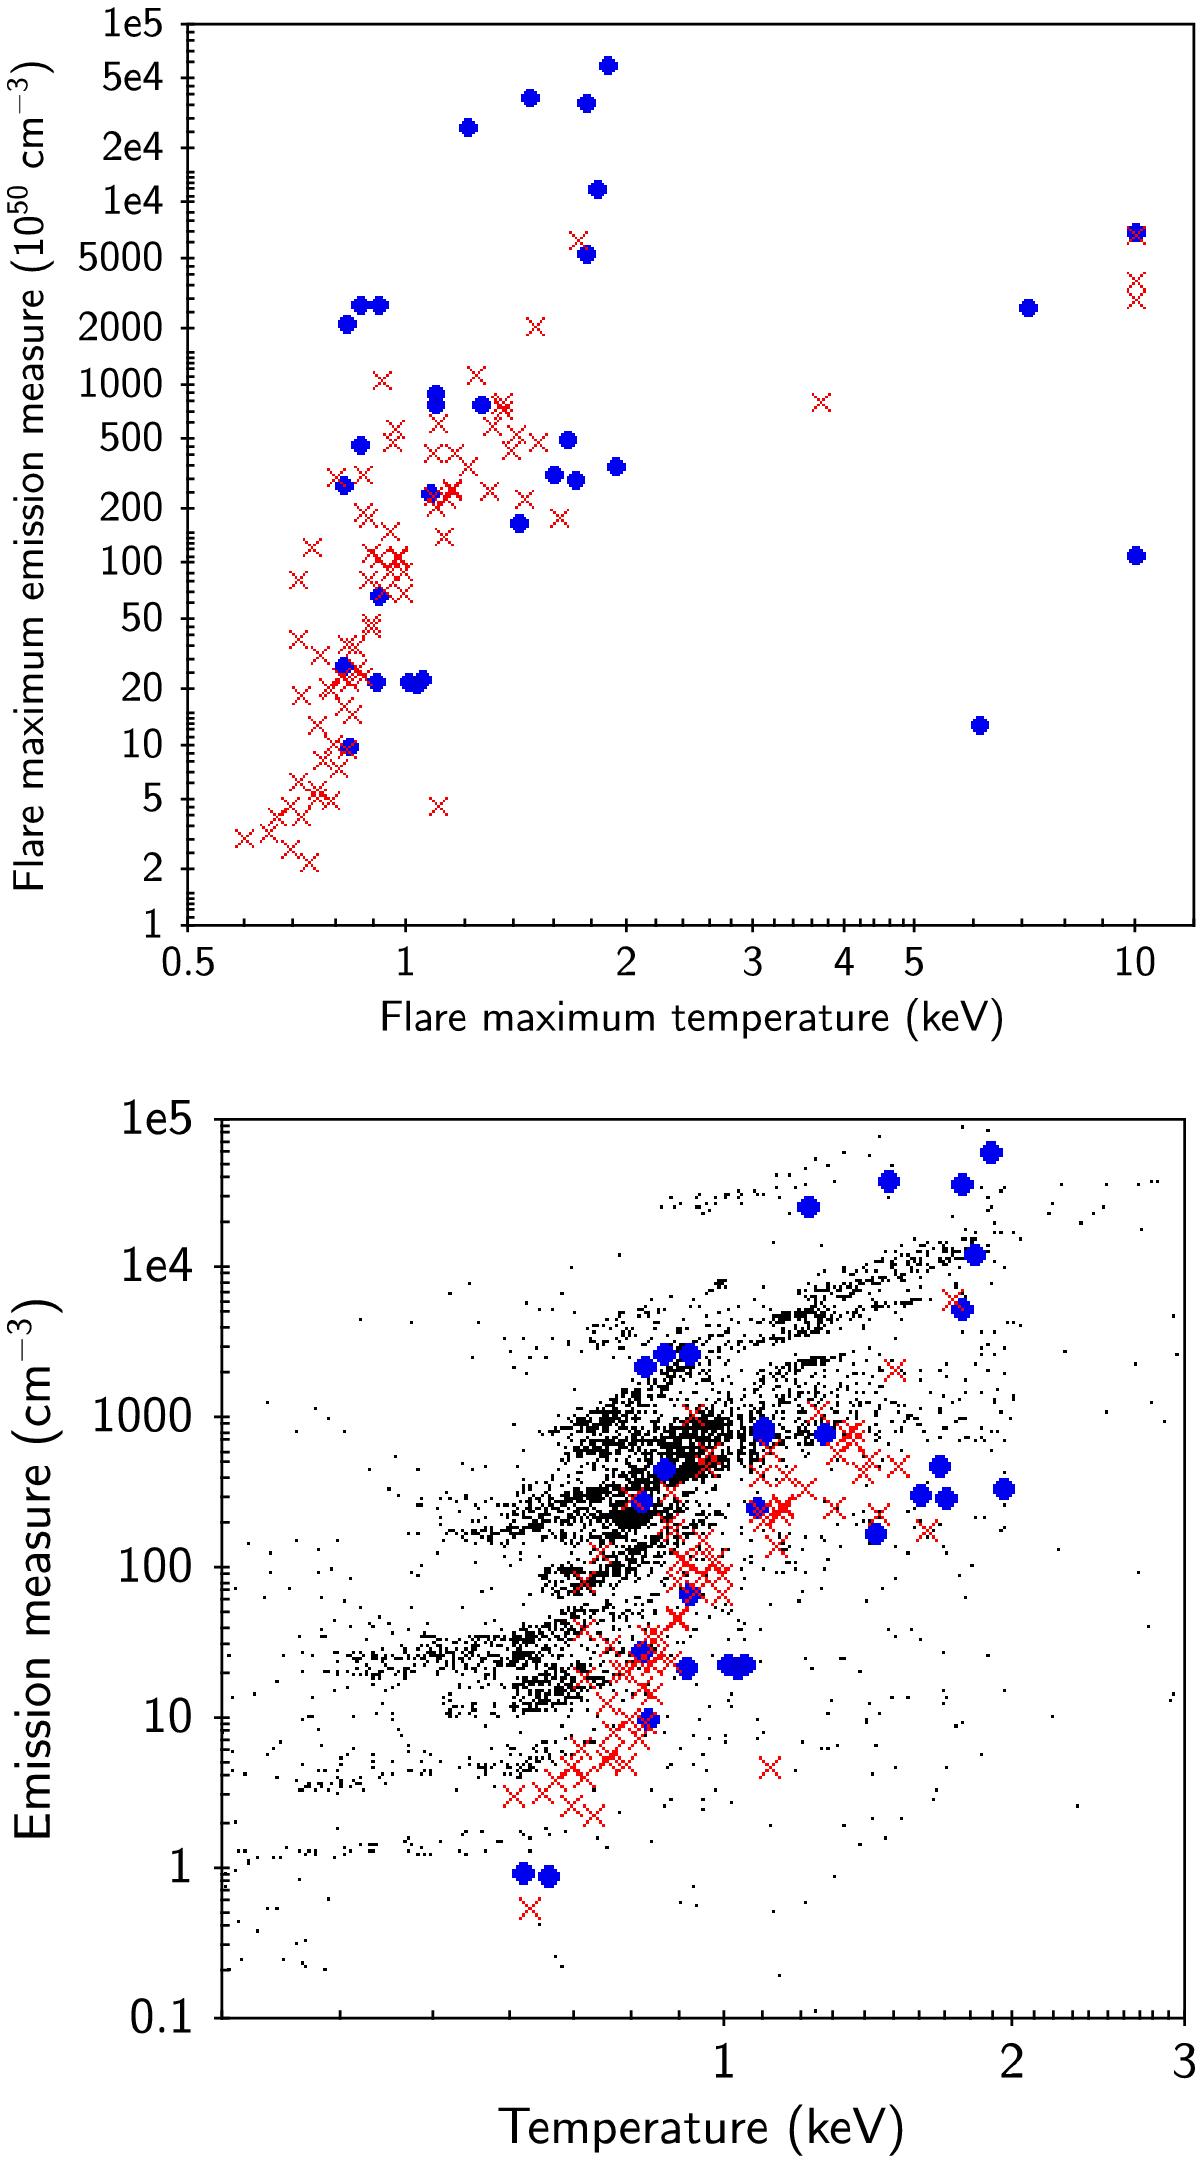
a) Flare maximum emission measure versus maximum temperature (energy band 0.2–12 keV). Symbols as in Fig. 6. b) As a) but also showing, as black dots, essentially all data points from the 2XMM-Tycho light-curves, i.e. each time bin (1 bin = 400 or 1600 s) in each light-curve is represented on the plot, irrespective of the presence of a flare; the temperature range has been restricted for clarity in showing the bulk of the distribution.
Current usage metrics show cumulative count of Article Views (full-text article views including HTML views, PDF and ePub downloads, according to the available data) and Abstracts Views on Vision4Press platform.
Data correspond to usage on the plateform after 2015. The current usage metrics is available 48-96 hours after online publication and is updated daily on week days.
Initial download of the metrics may take a while.