Fig. 3
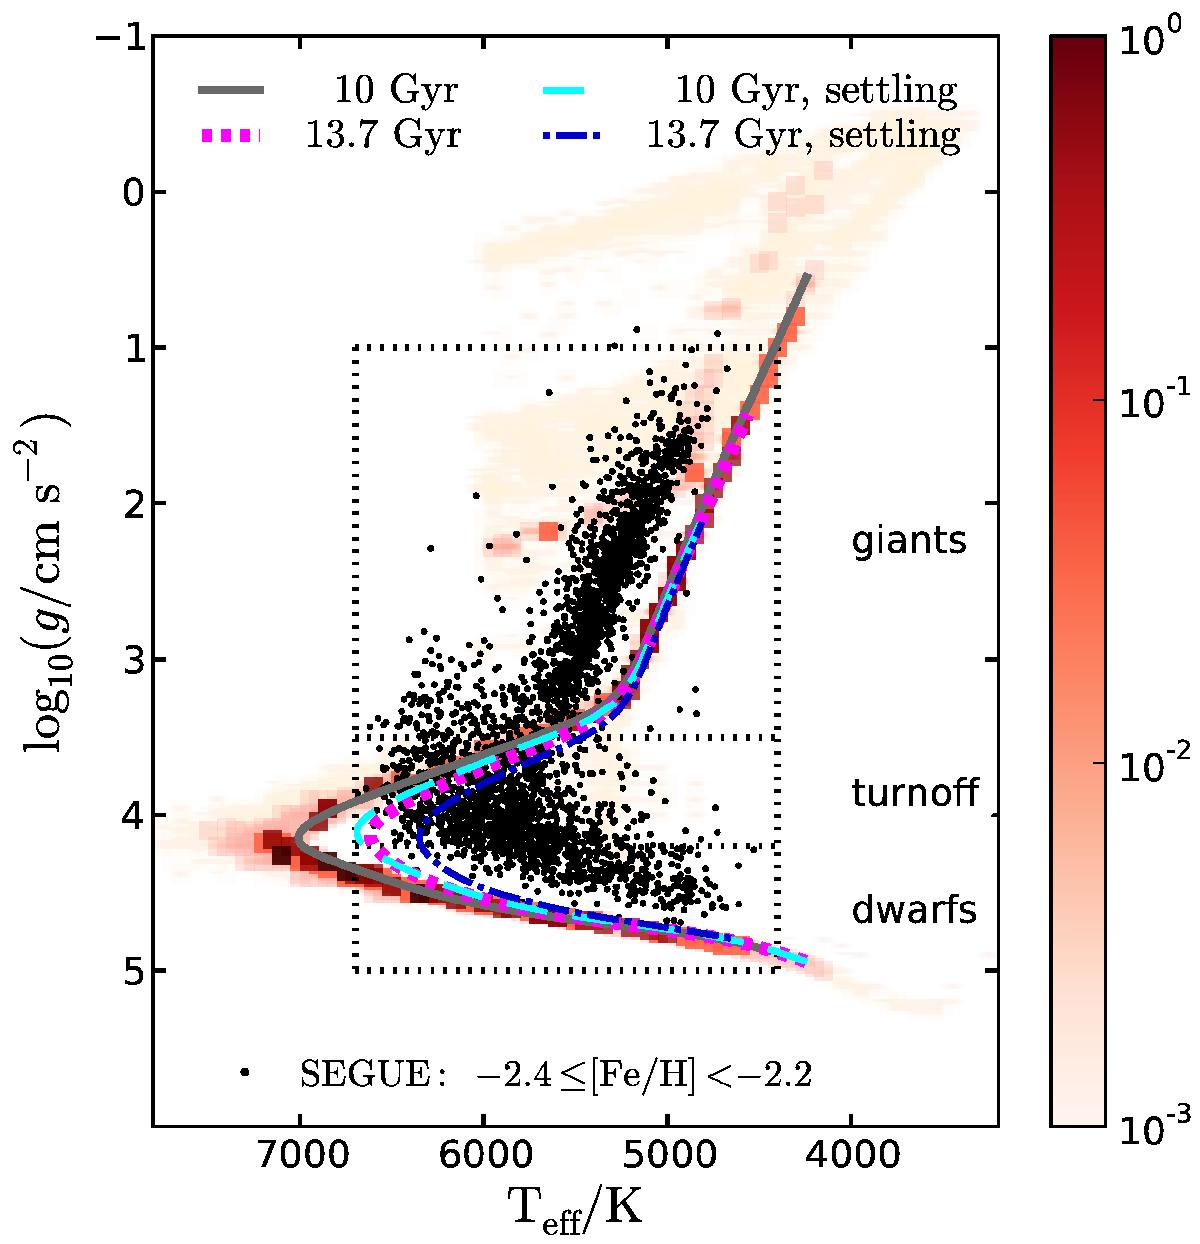
Teff − log 10g probability distribution of all stars in our simulation computed with model set A. Darker colours indicate regions of higher probability. The grey solid and magenta dotted lines show the isochrones computed with detailed stellar-evolution models at 10 Gyr and 13.7 Gyr, respectively. The isochrones computed for the same ages with a detailed model that includes gravitational settling are shown as light-blue dashed and blue dot-dashed lines, respectively. The black dotted lines indicate the ranges of Teff and log 10g in which Lee et al. (2013) select the SEGUE stars. Black circles indicate all SEGUE stars with −2.4 ≤ [Fe/H] < − 2.2.
Current usage metrics show cumulative count of Article Views (full-text article views including HTML views, PDF and ePub downloads, according to the available data) and Abstracts Views on Vision4Press platform.
Data correspond to usage on the plateform after 2015. The current usage metrics is available 48-96 hours after online publication and is updated daily on week days.
Initial download of the metrics may take a while.