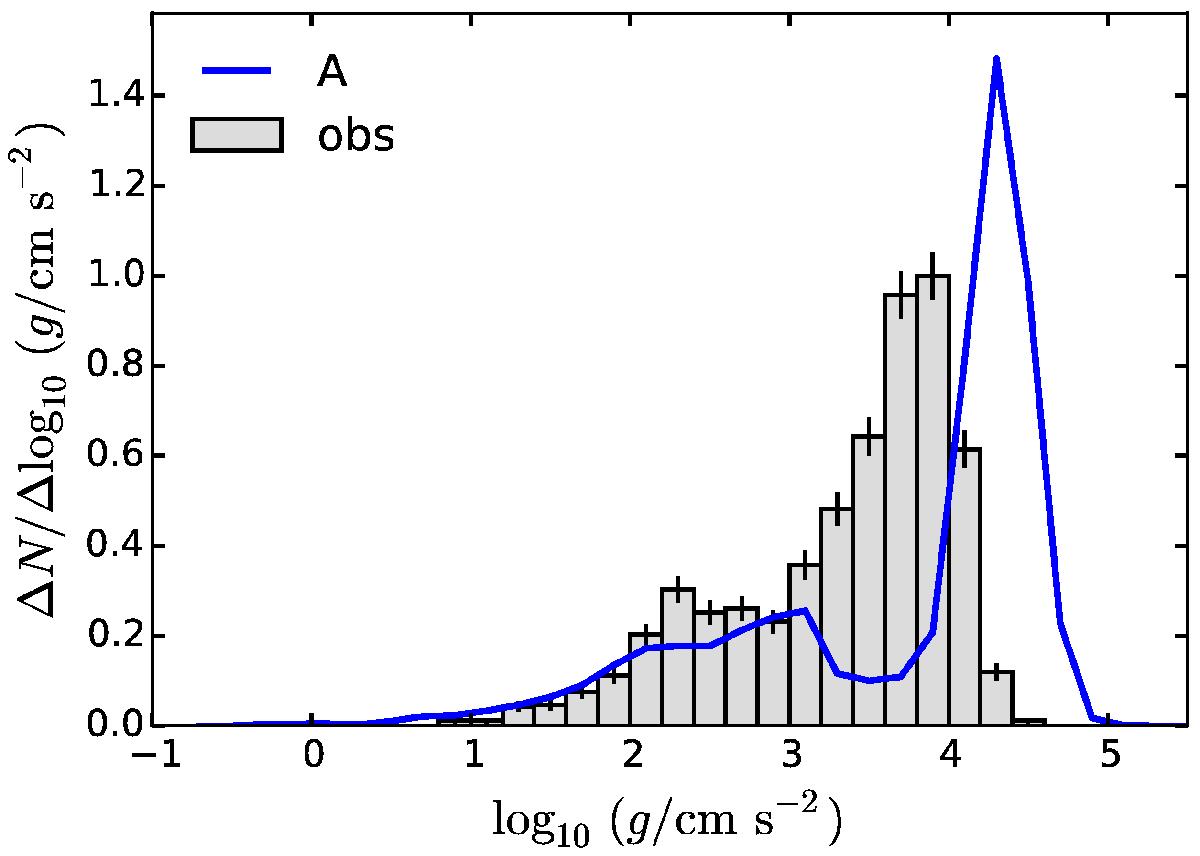
Fig. 2

Distribution of log 10(g/ cm s-2) as derived from the SEGUE sample of CEMP stars with −2.5 ≤ [Fe/H] ≤ − 2 (histogram with Poisson errors) and computed with our default model set A (solid line). The 0.2 dex bins are equally spaced in log 10(g/ cm s-2). In this and the similar plots that follow the area under the graph (which is the total number of stars) is normalised such that it is the same for both the observations and our model stars.
Current usage metrics show cumulative count of Article Views (full-text article views including HTML views, PDF and ePub downloads, according to the available data) and Abstracts Views on Vision4Press platform.
Data correspond to usage on the plateform after 2015. The current usage metrics is available 48-96 hours after online publication and is updated daily on week days.
Initial download of the metrics may take a while.


