Fig. 10
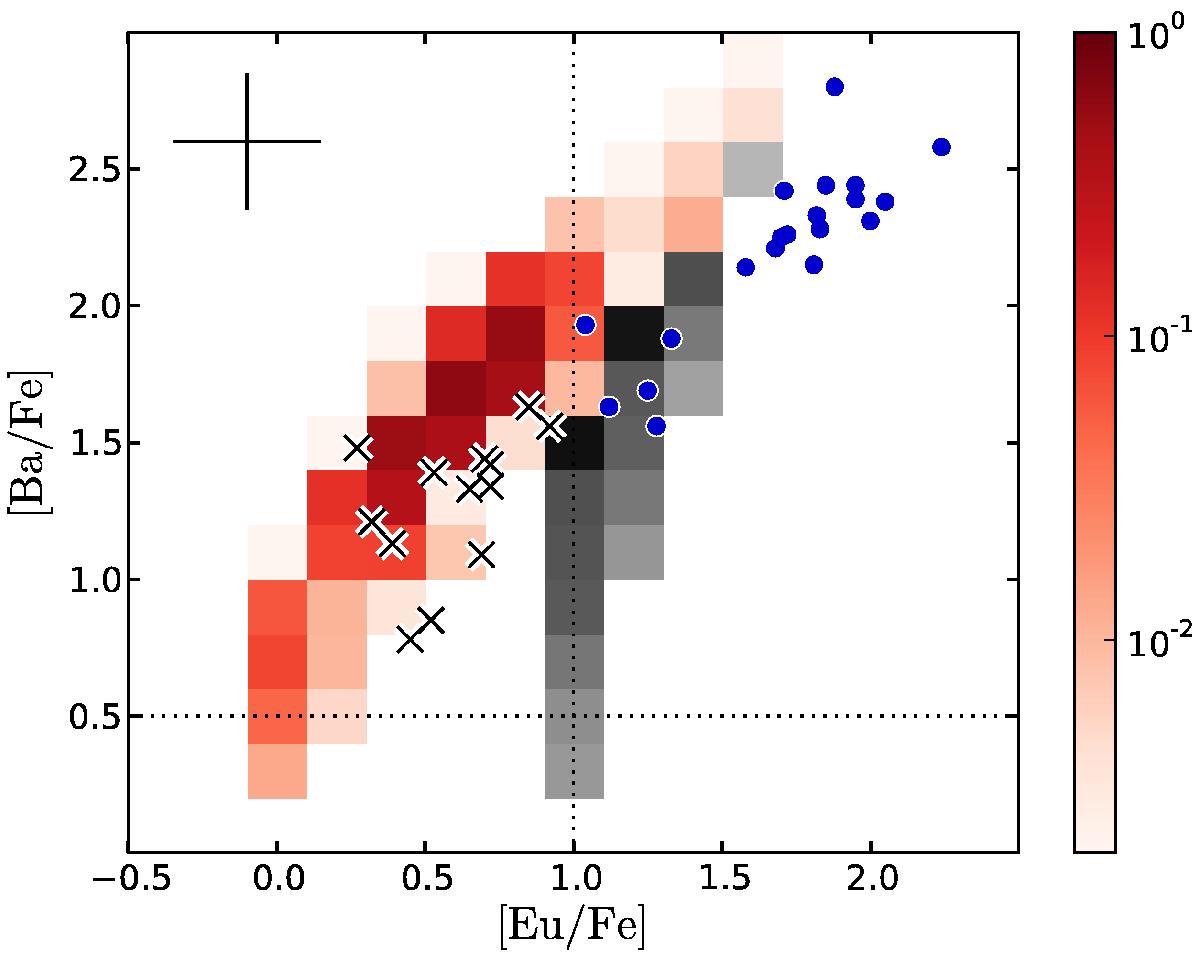
Distribution of [Ba/Fe] vs. [Eu/Fe]. The red distribution represents our default model A. The grey distribution is computed with an initial enhancement of [r/ Fe] ini = 1. The dotted lines indicate the thresholds [Ba/Fe] = + 0.5 and [Eu/Fe] = 1 that define CEMP-s and CEMP-s/r stars, respectively. The crosses indicate the observed CEMP-s stars with [Eu/Fe] < + 1. CEMP-s/r are shown as blue circles. The + symbol in the top-left corner shows the average observed uncertainty.
Current usage metrics show cumulative count of Article Views (full-text article views including HTML views, PDF and ePub downloads, according to the available data) and Abstracts Views on Vision4Press platform.
Data correspond to usage on the plateform after 2015. The current usage metrics is available 48-96 hours after online publication and is updated daily on week days.
Initial download of the metrics may take a while.