Free Access
Fig. 1
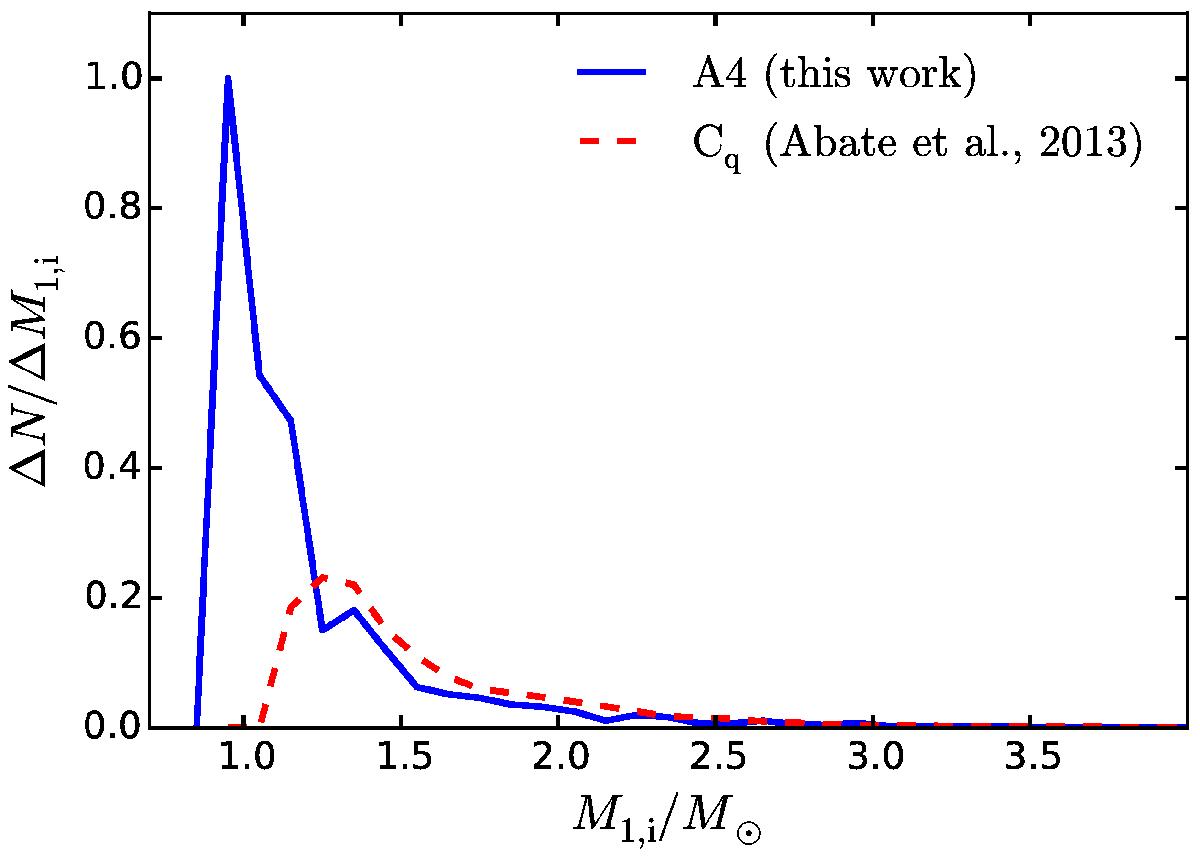
Distribution of M1,i computed with model set A4 (solid, blue line) and model set Cq of Abate et al. (2013; dashed, red line). The bins are equally spaced and the width in M1,i/M⊙ of each bin is 0.1. The y-axis indicates the number of CEMP stars in each bin, arbitrarily rescaled.
Current usage metrics show cumulative count of Article Views (full-text article views including HTML views, PDF and ePub downloads, according to the available data) and Abstracts Views on Vision4Press platform.
Data correspond to usage on the plateform after 2015. The current usage metrics is available 48-96 hours after online publication and is updated daily on week days.
Initial download of the metrics may take a while.