Fig. 7
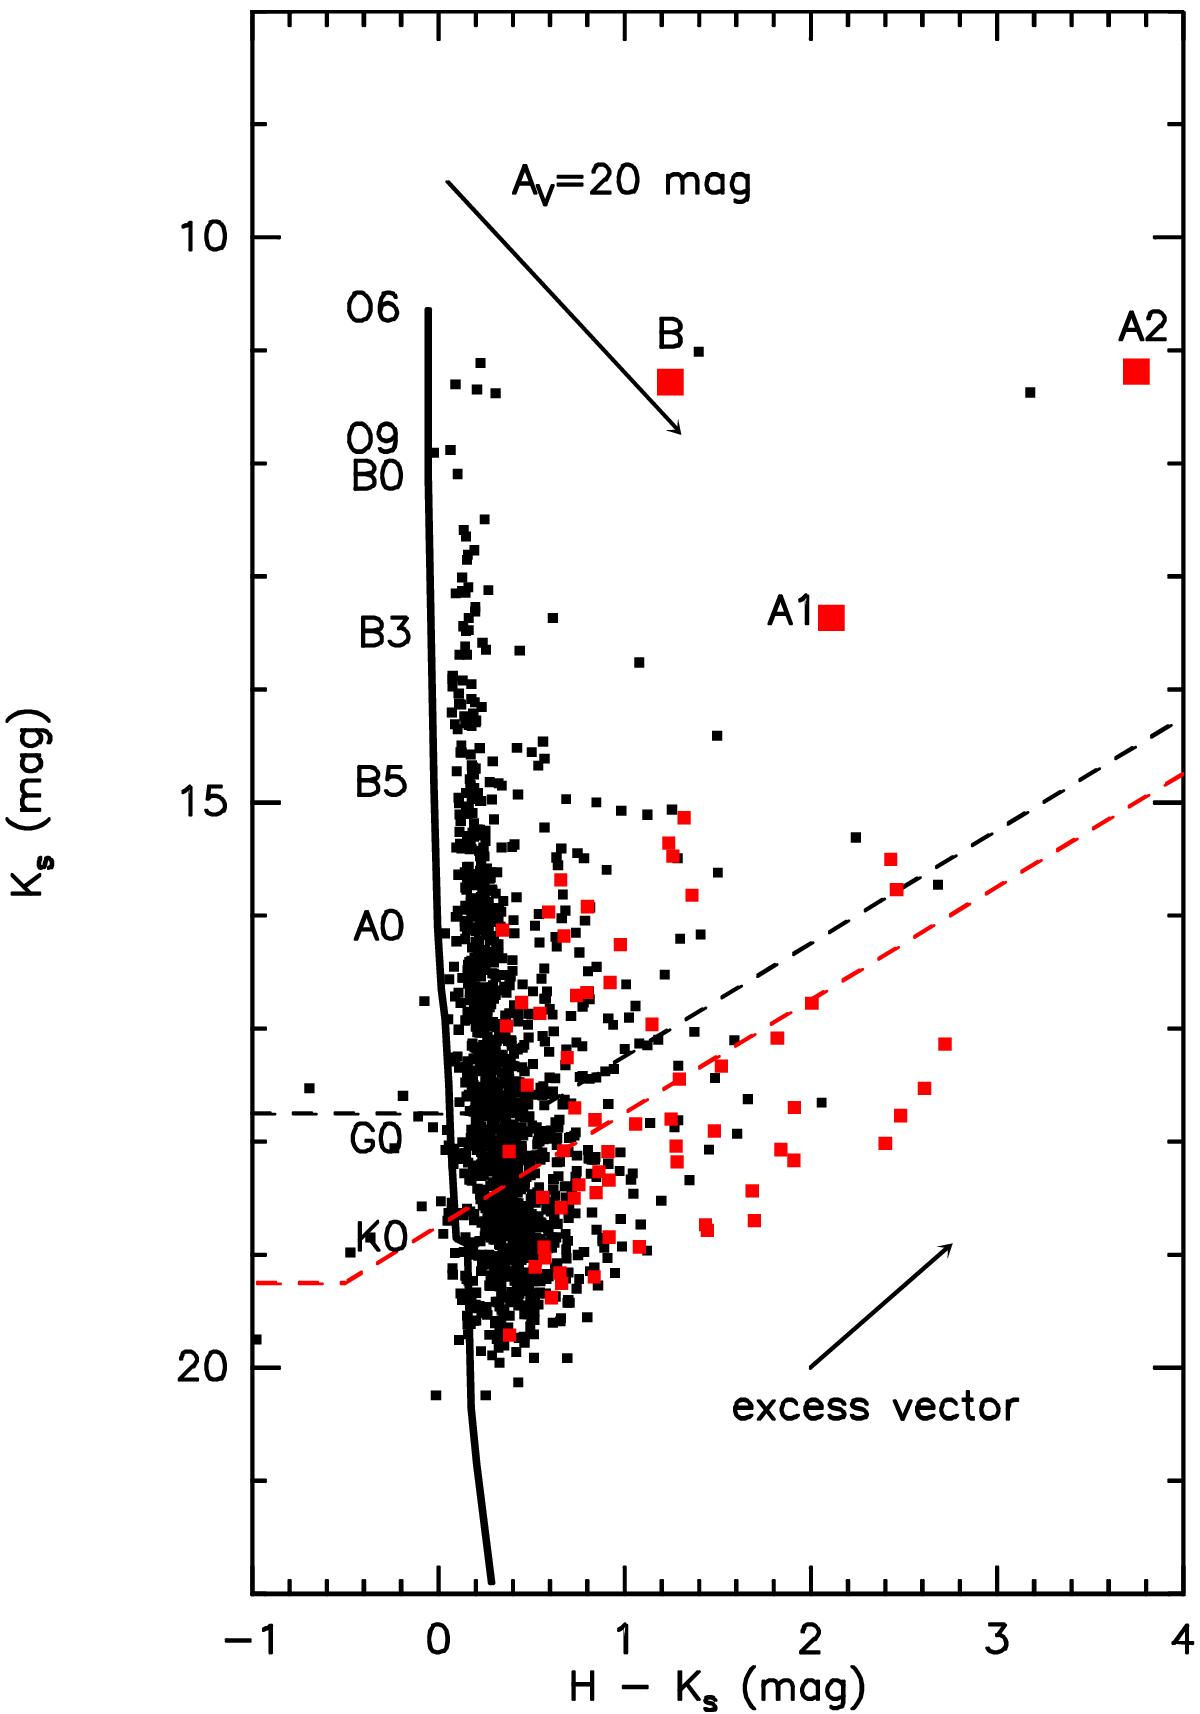
Ks vs. H–Ks diagram of the sources retrieved in the LUCI field (black squares) and in the PISCES field (red squares). The dashed lines shows the completeness limit of the LUCI photometry (black) and the PISCES photometry (red). The black solid line is the ZAMS at a distance of 8.3 kpc (derived using the colours of Koornneef 1983 and the absolute magnitudes of Allen 1976 and Panagia 1973). The position of a few spectral types is labelled. The arrow in the top shows the effects of an extinction of AV = 20 (according to Rieke & Lebofsky 1985). The arrow in the bottom corresponds to the median disk excess vector of López-Chico & Salas (2007) for the accretion disk models of D’Alessio et al. (2005). The three brightest members of the cluster C1 are labelled, as well.
Current usage metrics show cumulative count of Article Views (full-text article views including HTML views, PDF and ePub downloads, according to the available data) and Abstracts Views on Vision4Press platform.
Data correspond to usage on the plateform after 2015. The current usage metrics is available 48-96 hours after online publication and is updated daily on week days.
Initial download of the metrics may take a while.