Fig. 6
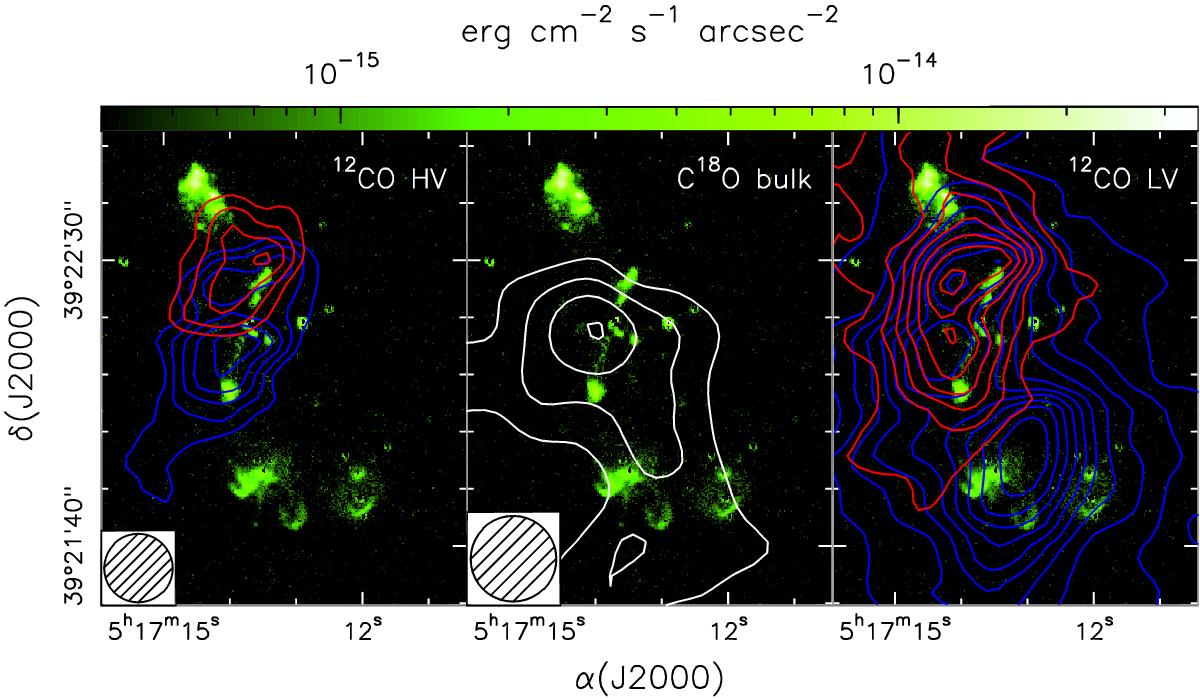
Left: IRAM 30-m maps obtained by averaging the 12CO(2–1) over the HV line wings, overlaid on the H2 line (i.e. continuum subtracted) emission image obtained with LUCI. The integration has been performed over the LSR velocity intervals –35.65, –32.65 km s-1 (blue contours) and –17.65, –14.65 km s-1 (red contours). Contour levels range from 0.8 to 4.16 in steps of 0.48 K. The circle in the bottom left denotes the HPBW of the 30-m telescope. Right: same as left panel, for the 12CO(2–1) LV wing emission. The integration was performed over the intervals –29.65, –27.65 km s-1 (blue contours) and –22.65, –20.65 km s-1 (red contours). Contour levels range from 1.2 to 15.6 in steps of 1.44 K. Middle: map of the C18O(2–1) line emission averaged over the line, from –27.65 to –24.15 km s-1. Contour levels range from 0.54 to 1.62 in steps of 0.36 K.
Current usage metrics show cumulative count of Article Views (full-text article views including HTML views, PDF and ePub downloads, according to the available data) and Abstracts Views on Vision4Press platform.
Data correspond to usage on the plateform after 2015. The current usage metrics is available 48-96 hours after online publication and is updated daily on week days.
Initial download of the metrics may take a while.