Fig. 4
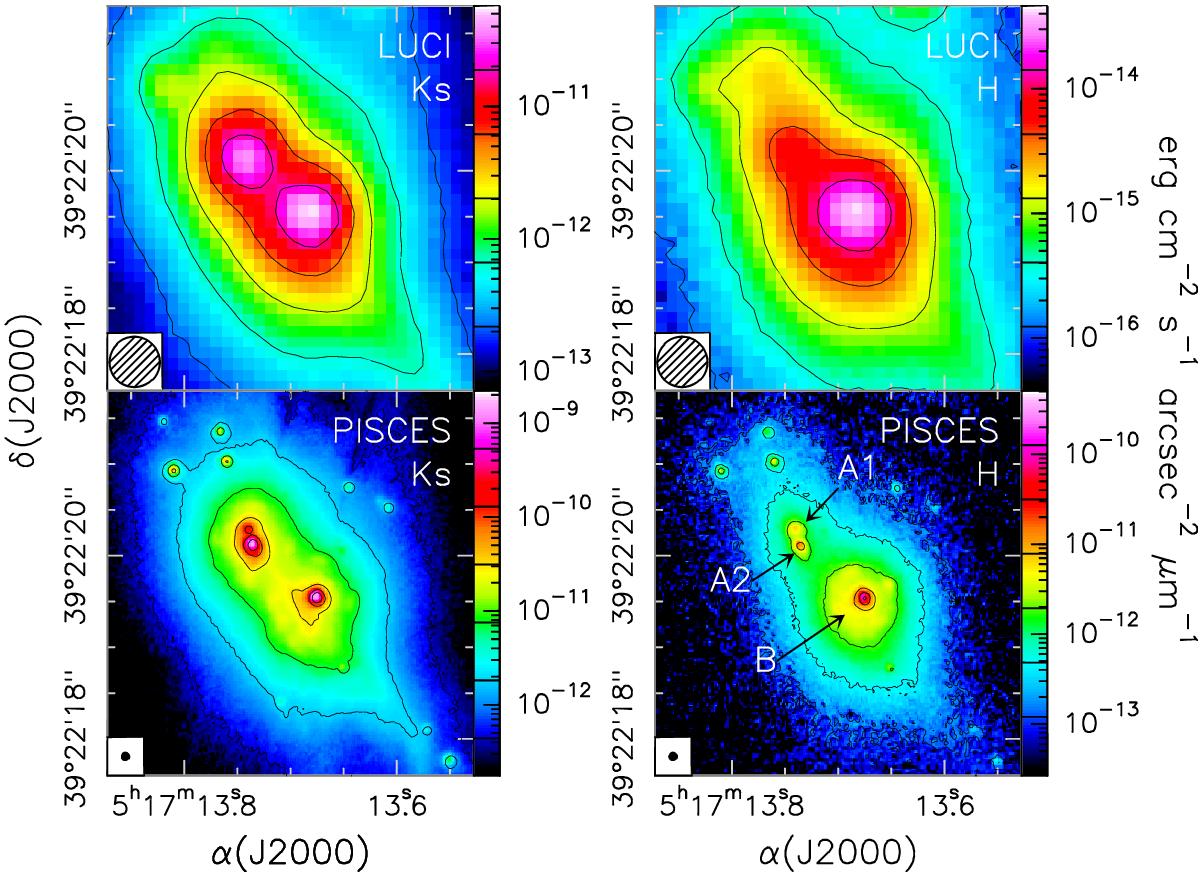
Images of the central region of clump/cluster C1, where a pair of bright stars (A and B) had been detected in previous studies. The left and right panels refer, respectively, to Ks and H band images, while the upper and lower panels show, respectively, images obtained with the LUCI and PISCES+AO cameras. The values of the contour levels are indicated by marks in the corresponding colour scales. Note how employing AO allows us to resolve star A into the two sources A1 and A2.
Current usage metrics show cumulative count of Article Views (full-text article views including HTML views, PDF and ePub downloads, according to the available data) and Abstracts Views on Vision4Press platform.
Data correspond to usage on the plateform after 2015. The current usage metrics is available 48-96 hours after online publication and is updated daily on week days.
Initial download of the metrics may take a while.