Fig. 2
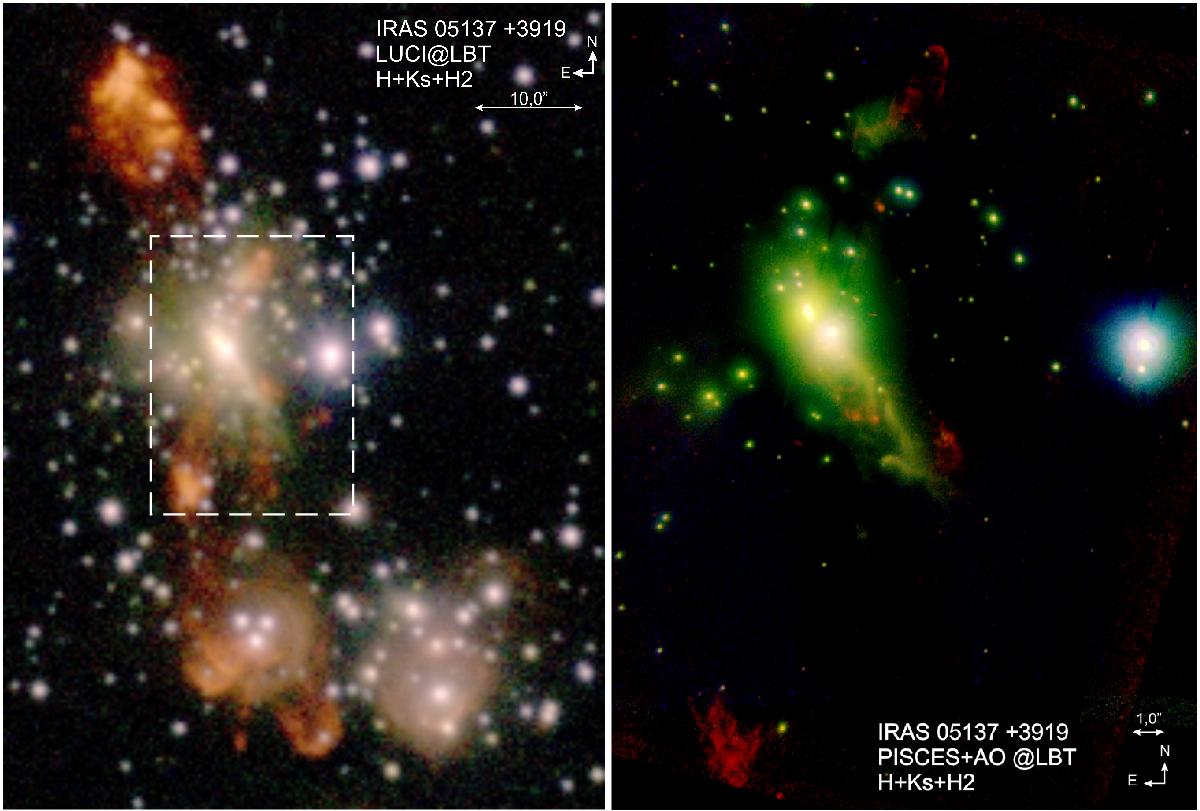
Composite colour images obtained by combining the emission in the H2 (red), Ks (green), and H (blue) filters from the LUCI (left panel) and PISCES (right panel) data. The dashed box in the left panel indicates the region shown in the right panel. The LUCI and PISCES images cover regions, respectively, of about 0.́8 × 1.́1 and 0.́3 × 0.́4.
Current usage metrics show cumulative count of Article Views (full-text article views including HTML views, PDF and ePub downloads, according to the available data) and Abstracts Views on Vision4Press platform.
Data correspond to usage on the plateform after 2015. The current usage metrics is available 48-96 hours after online publication and is updated daily on week days.
Initial download of the metrics may take a while.