Fig. 14
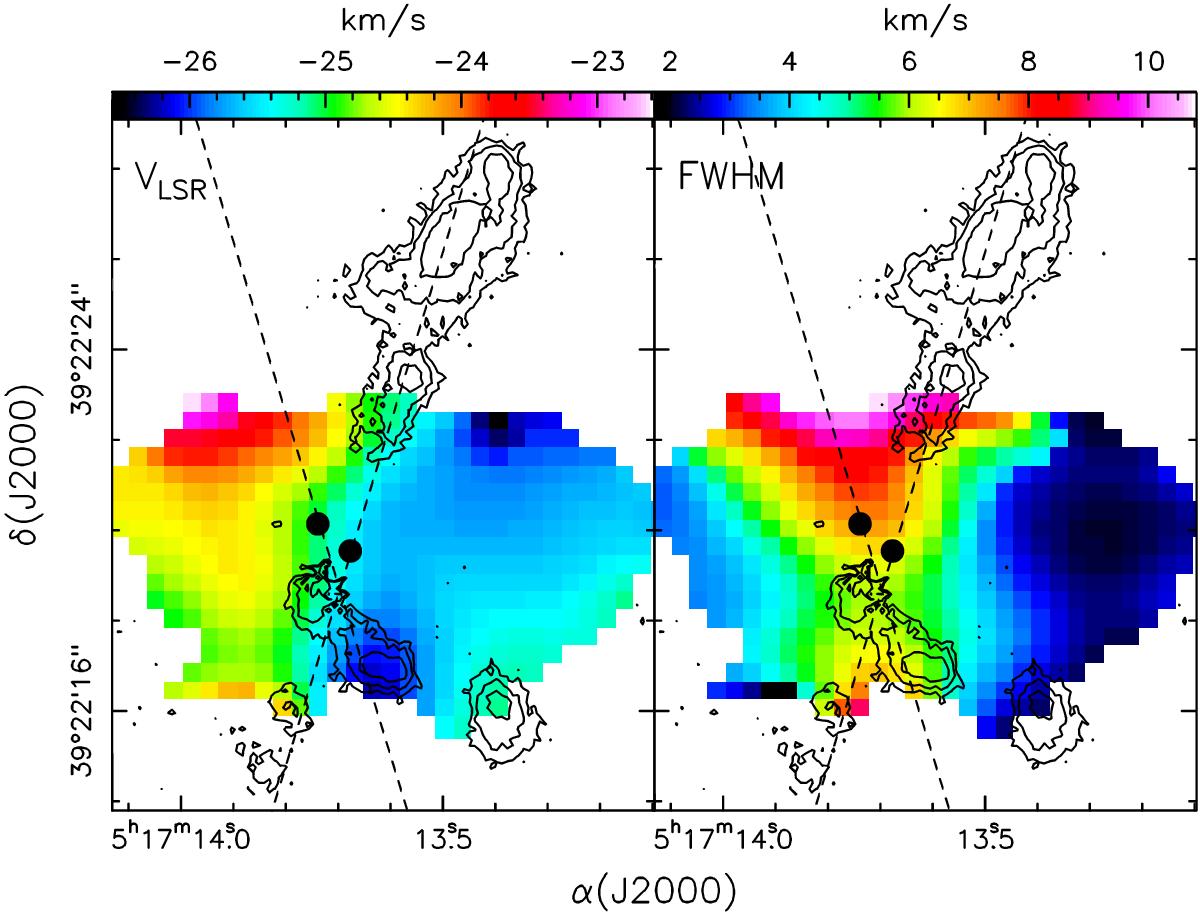
Left: overlay of the H2 line (i.e. continuum subtracted) LUCI image (contours) on a map of the peak LSR velocity of the HCO+(1–0) line observed by Molinari et al. (2002). The artefacts due to continuum subtraction in the H2 image have been blanked as already done in Fig. 12. The dashed lines represent the axes of Jet 1 and Jet 2, while the two black points indicate the positions of stars A1+A2 and B. Right: same as left panel, for the HCO+(1–0) line full width at half maximum.
Current usage metrics show cumulative count of Article Views (full-text article views including HTML views, PDF and ePub downloads, according to the available data) and Abstracts Views on Vision4Press platform.
Data correspond to usage on the plateform after 2015. The current usage metrics is available 48-96 hours after online publication and is updated daily on week days.
Initial download of the metrics may take a while.