Fig. 13
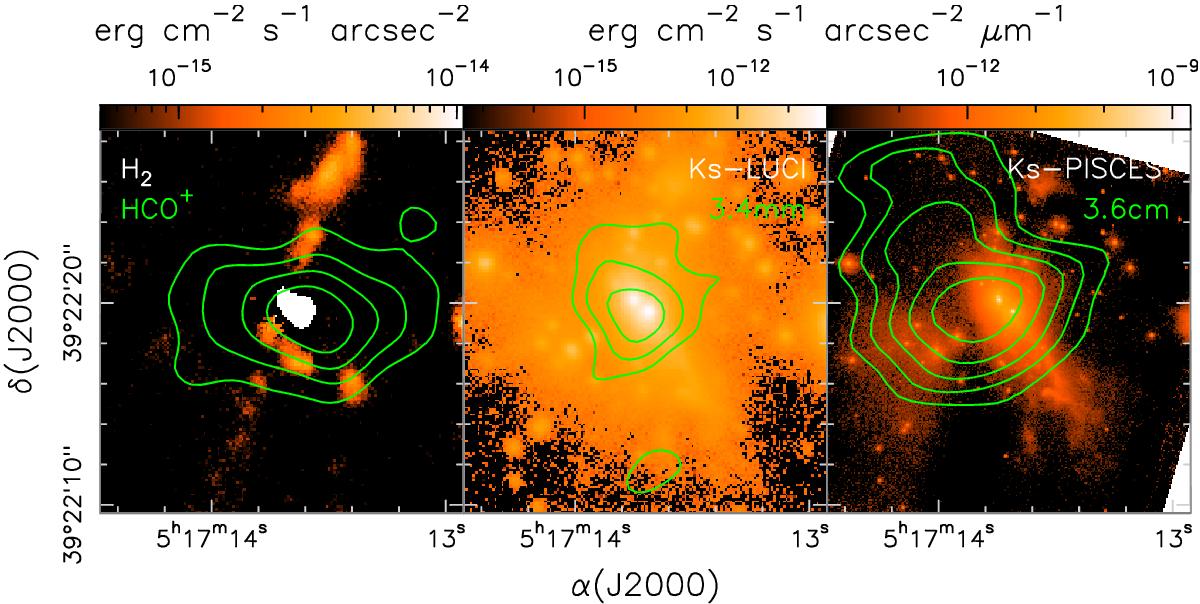
Left: overlay of the contour map of the HCO+(1–0) line (from Molinari et al. 2002) obtained by averaging the emission between –27.08 and –23.72 km s-1, on the H2 line (i.e. continuum subtracted) LUCI image. Contour levels range from 150 to 420 in steps of 90 mJy/beam. Like in Fig. 12, the area around stars A1, A2, and B has been blanked to mask an artefact caused by the continuum-subtraction process. Middle: overlay of the contour map of the 3.4 mm continuum emission (from Molinari et al. 2002) on the 2.2 μm continuum LUCI image. Contour levels range from 2.64 to 4.4 in steps of 0.88 mJy/beam. Right: overlay of the contour map of the 3.6 cm continuum emission (from Molinari et al. 2002) on the 2.2 μm continuum PISCES image. Contour levels range from 0.069 to 0.161 in steps of 0.023 mJy/beam.
Current usage metrics show cumulative count of Article Views (full-text article views including HTML views, PDF and ePub downloads, according to the available data) and Abstracts Views on Vision4Press platform.
Data correspond to usage on the plateform after 2015. The current usage metrics is available 48-96 hours after online publication and is updated daily on week days.
Initial download of the metrics may take a while.