Fig. 12
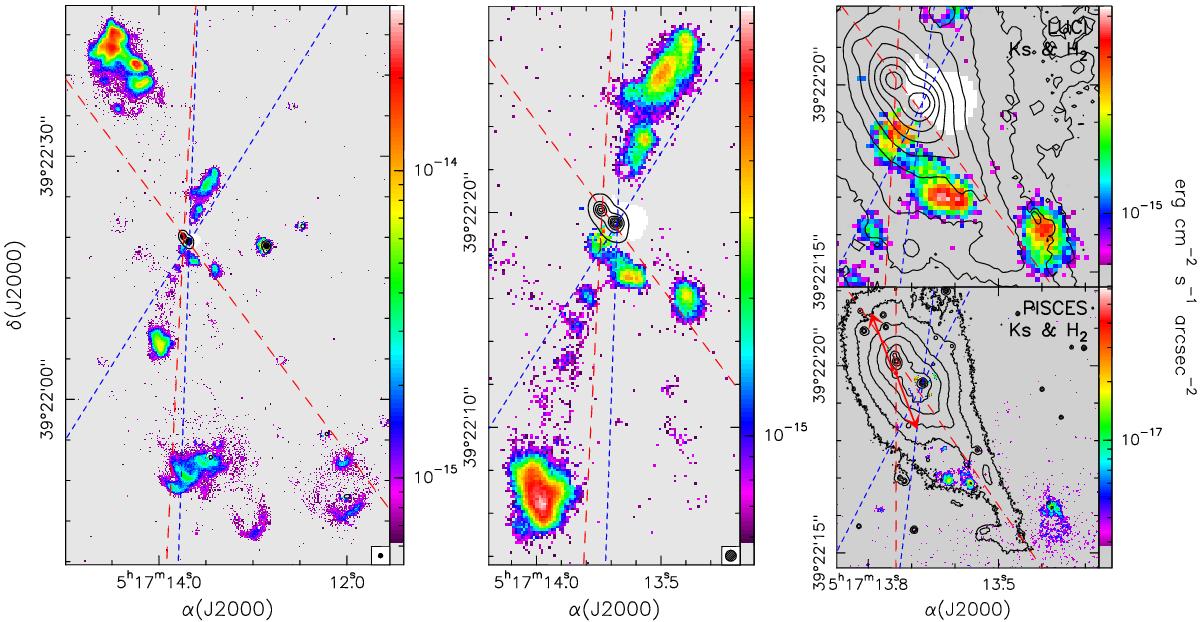
Left: LUCI image of the H2 line emission (continuum subtracted) tracing the jets in IRAS 05137+3919. The artefact due to continuum subtraction at the position of stars A1, A2, and B has been blanked (white area). The contours are a map of the continuum emission measured in the Ks filter. The contour levels have been chosen to show only the brightest stars in the field. The red long-dash and blue short-dash lines indicate, respectively, the borders of Jet 1 and Jet 2. Middle: same as left panel, for a smaller region centred on the jets’ origin. Right: same as left panel, for a comparison between the H2 line and Ks continuum images taken with LUCI (top) and PISCES (bottom). The red points and corresponding arrows denote the H2O maser spots and associated relative proper motions measured by Honma et al. (2011).
Current usage metrics show cumulative count of Article Views (full-text article views including HTML views, PDF and ePub downloads, according to the available data) and Abstracts Views on Vision4Press platform.
Data correspond to usage on the plateform after 2015. The current usage metrics is available 48-96 hours after online publication and is updated daily on week days.
Initial download of the metrics may take a while.