Fig. 10
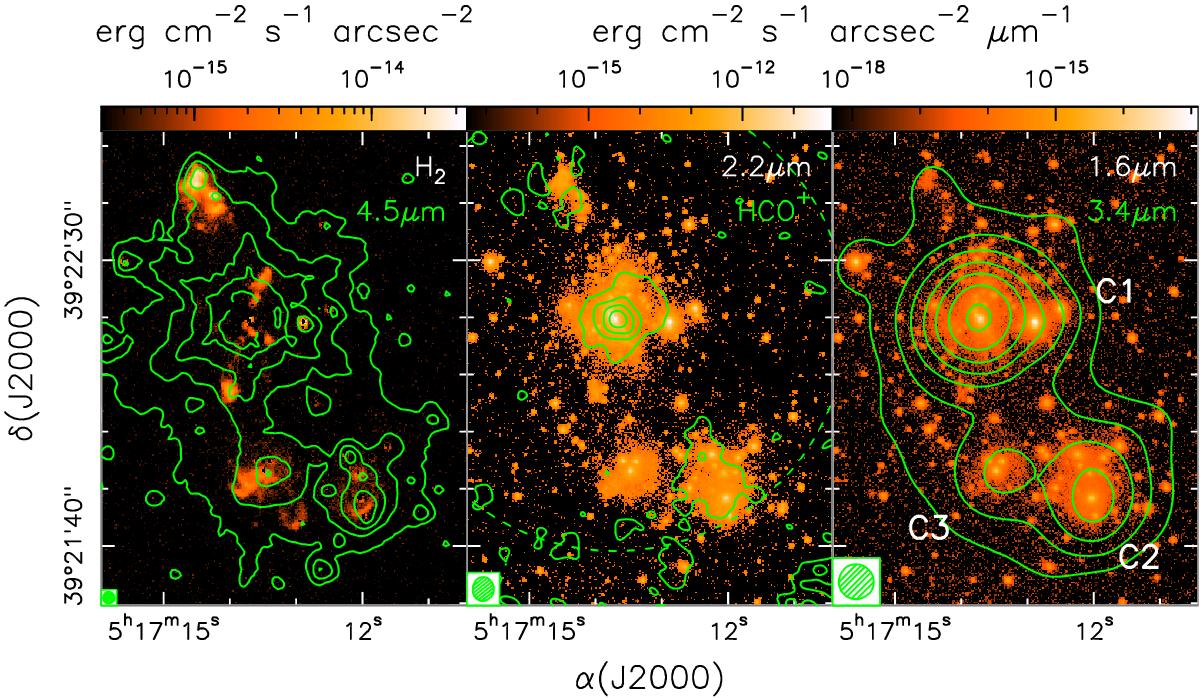
Left: overlay of the 4.5 μm Spitzer/IRAC image (contours) on the LBT/LUCI image of the H2 line emission (continuum subtracted). Contours are drawn in 5 logarithmic steps from 1 to 60 MJy/sterad. The angular resolution of the contour maps is indicated by the circle in the bottom left. Middle: same as left panel, for the overlay of the HCO+(1–0) line OVRO map by Molinari et al. (2002), corrected for primary beam attenuation, on our LBT/LUCI Ks-filter image. The HCO+ map has been obtained by averaging the emission between –28.76 and –20.78 km s-1. Contour levels range from 57 to 342 in steps of 95 mJy/beam. The dashed circle denotes the primary beam of the OVRO interferometer. Right: same as left panel, for the overlay of the WISE 3.4 μm map on the LBT/LUCI H-filter image. Contours are drawn in 6 logarithmic steps from 1 to 76 MJy/sterad. Labels C1, C2, and C3 have the same meaning as in Fig 1.
Current usage metrics show cumulative count of Article Views (full-text article views including HTML views, PDF and ePub downloads, according to the available data) and Abstracts Views on Vision4Press platform.
Data correspond to usage on the plateform after 2015. The current usage metrics is available 48-96 hours after online publication and is updated daily on week days.
Initial download of the metrics may take a while.