Fig. 1
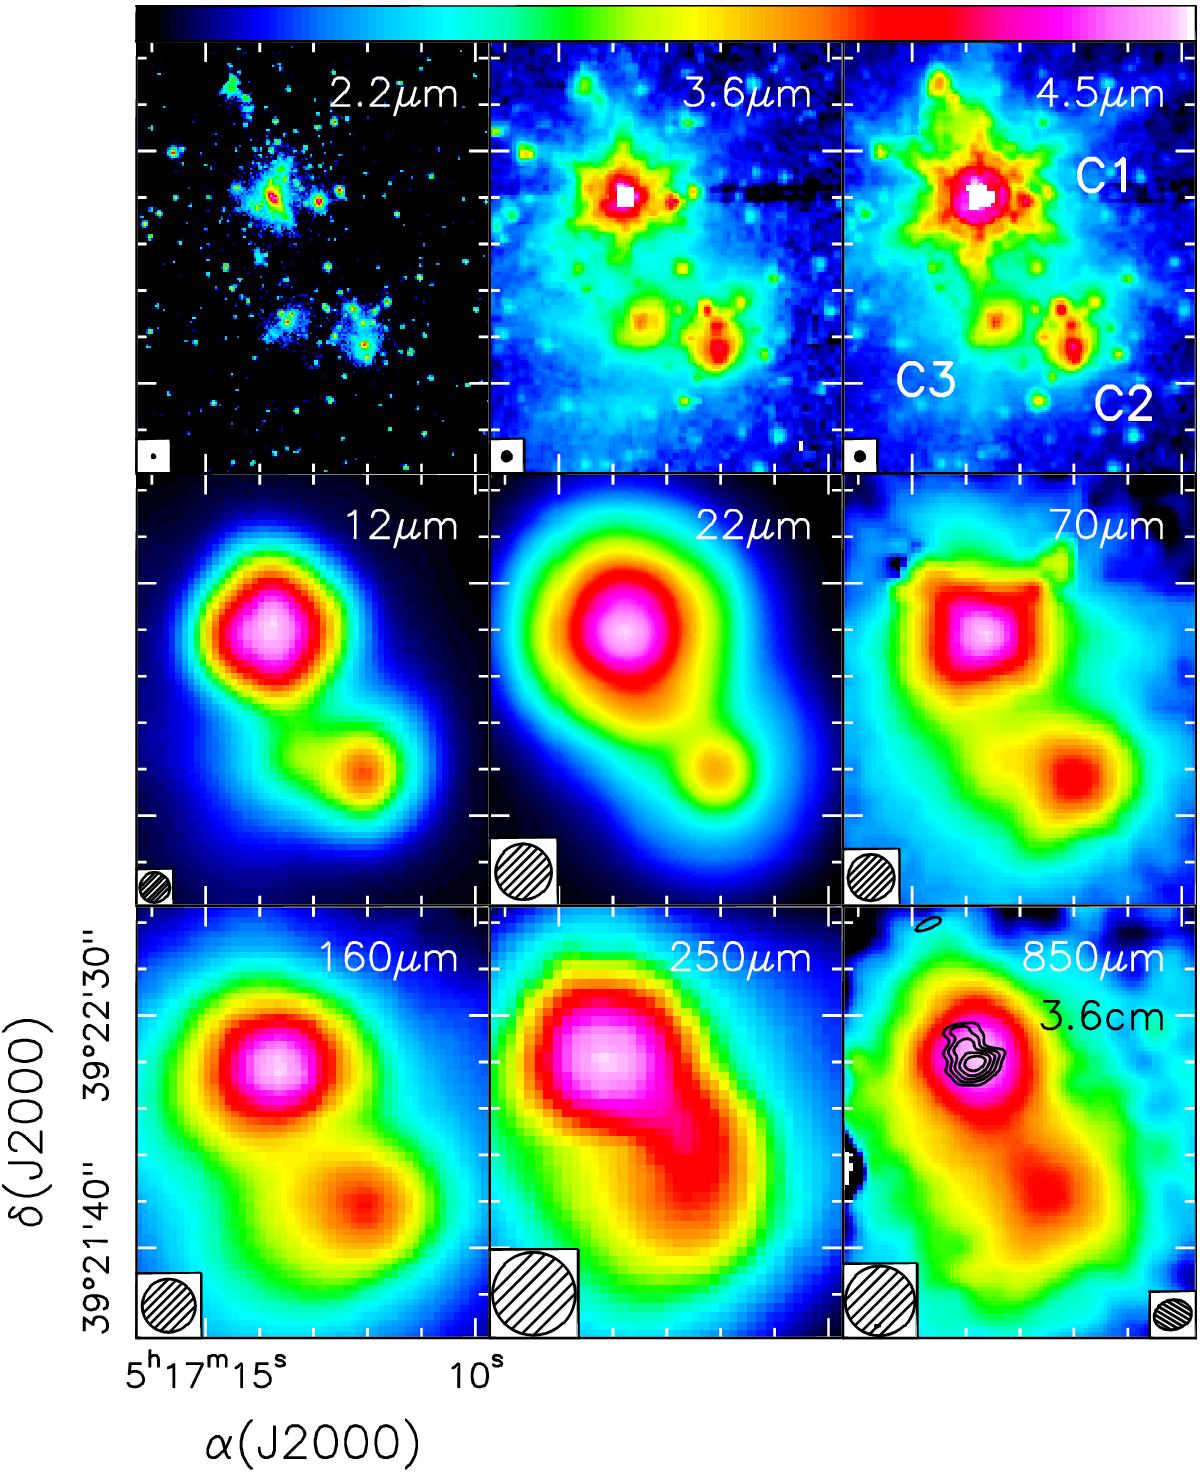
Maps of the continuum emission towards IRAS 05137+3919 at different wavelengths (given in the top right of each panel). The labels in the top, right panel indicate the three clumps/clusters that we refer to in the text. The images have been taken from our LUCI data (2.2 μm), the IRAC database (at 3.4 and 4.6 μm), the WISE archive (12 and 22 μm), the Herschel/Hi-GAL survey (70–250 μm), and Molinari et al. (2008) (850 μm). The contours in the bottom right panel are the map of the 3.6 cm continuum emission observed by Molinari et al. (2002), while the ellipse in the bottom right denotes the corresponding angular resolution. The circle in the bottom left of each panel represents the HPBW of the corresponding image.
Current usage metrics show cumulative count of Article Views (full-text article views including HTML views, PDF and ePub downloads, according to the available data) and Abstracts Views on Vision4Press platform.
Data correspond to usage on the plateform after 2015. The current usage metrics is available 48-96 hours after online publication and is updated daily on week days.
Initial download of the metrics may take a while.