Fig. 7
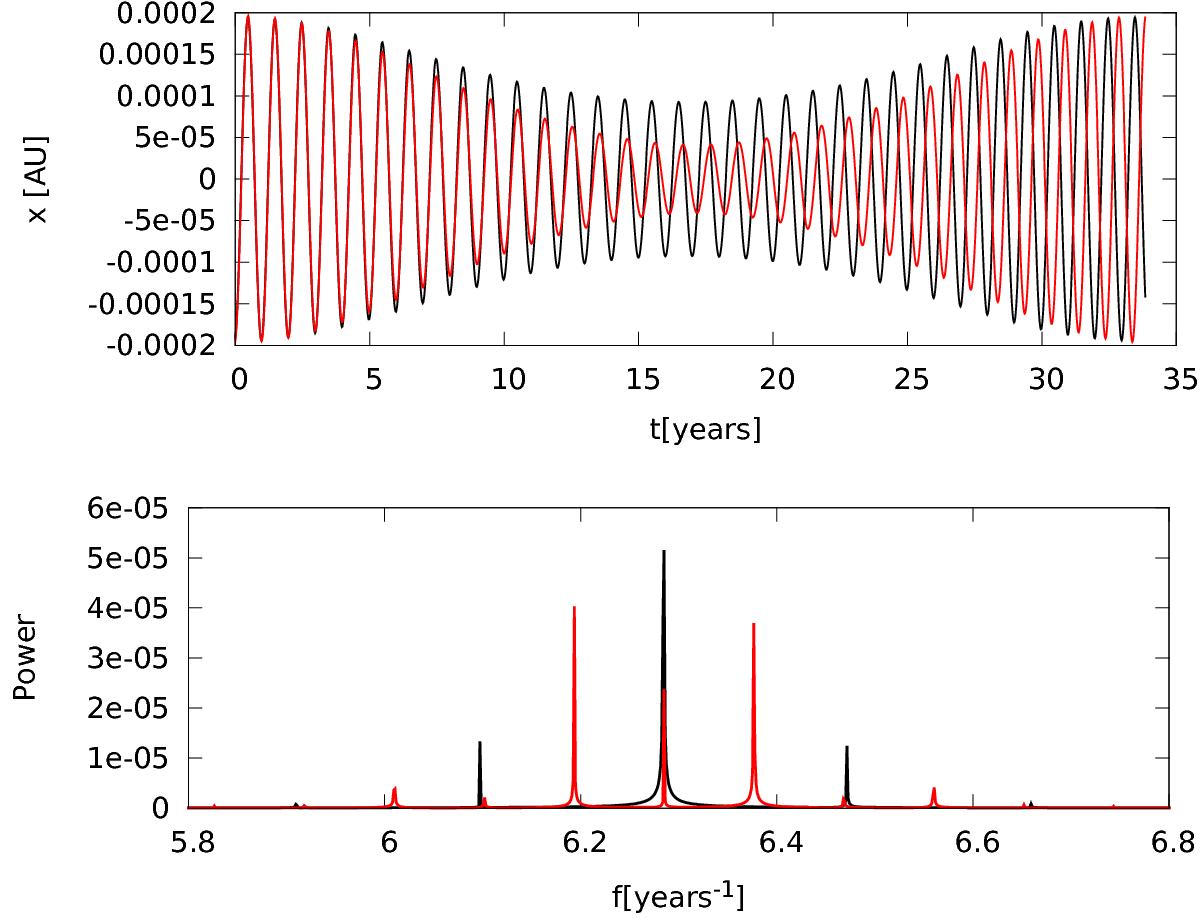
Motion of the star in the configurations of Fig. 6 in the direction x in the inertial frame. In black is the tadpole orbit and in red the horseshoe. The top graph represents the evolution of the position of the star over time and the bottom graph its spectrum. In these examples, the libration period of the horseshoe orbits is about twice the period of the tadpole orbits. See the text for more details.
Current usage metrics show cumulative count of Article Views (full-text article views including HTML views, PDF and ePub downloads, according to the available data) and Abstracts Views on Vision4Press platform.
Data correspond to usage on the plateform after 2015. The current usage metrics is available 48-96 hours after online publication and is updated daily on week days.
Initial download of the metrics may take a while.