Fig. 5
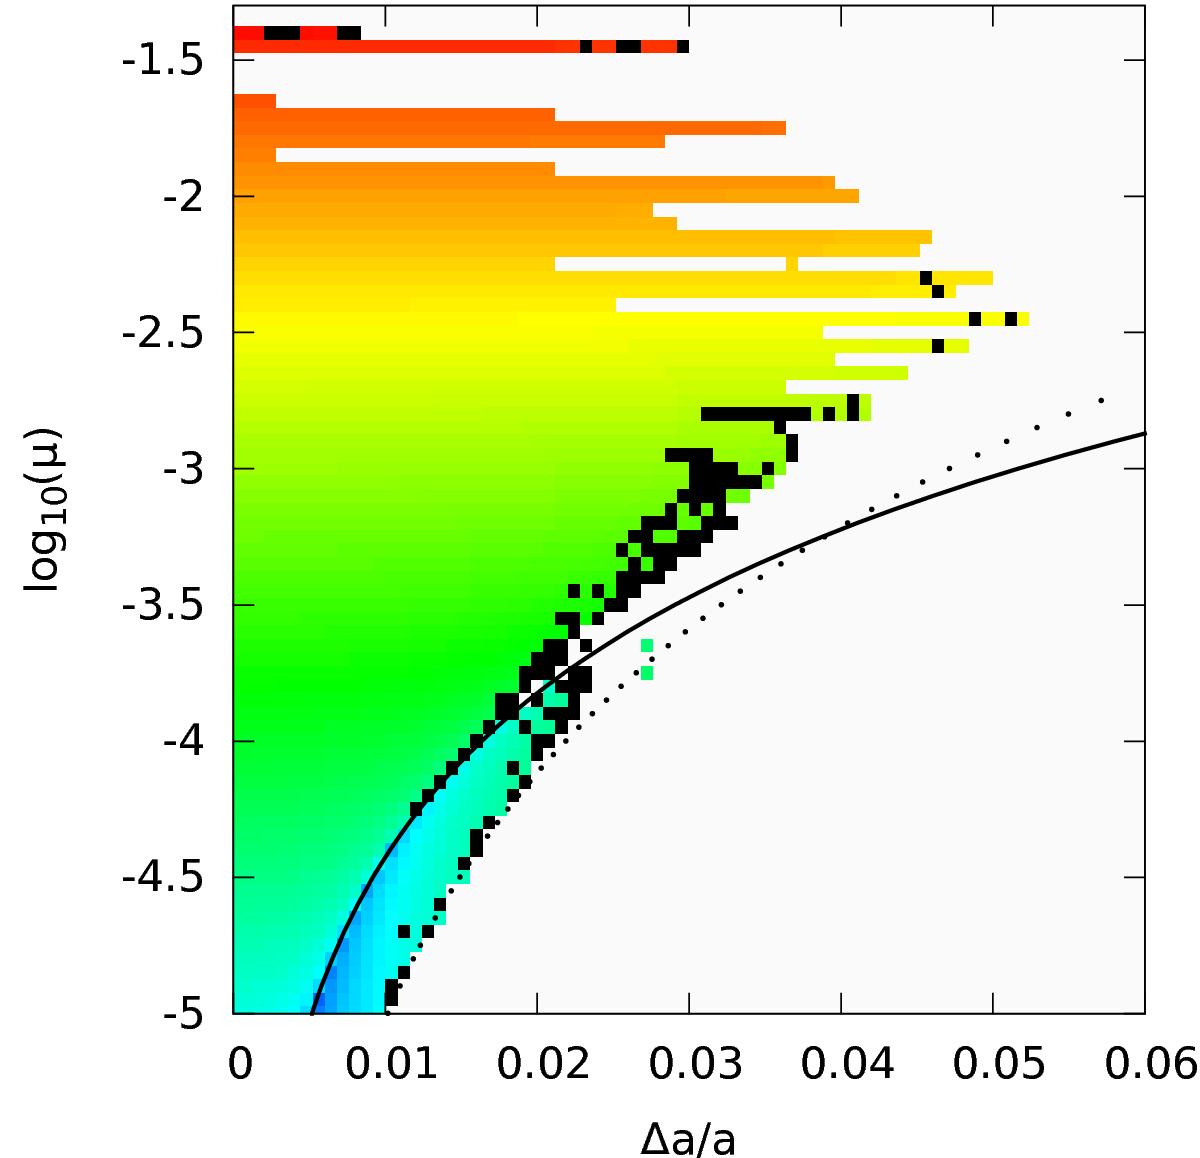
Stability of co-orbitals as a function of log 10(μ) and Δa/a. The initial conditions are ζ0 = π/ 3 and Δa/a ∈ [ 0,0.06 ]: vertical purple line in Fig. 2. The black line indicates the separatrix between the tadpole and the horseshoe domains. The dots follow a curve Δa ∝ μ1 / 3, delimiting the stability region of the horseshoe domain. The colour code indicates the value of the libration frequency, i.e. log 10(ν/n) (see Fig. 4 for the scale).
Current usage metrics show cumulative count of Article Views (full-text article views including HTML views, PDF and ePub downloads, according to the available data) and Abstracts Views on Vision4Press platform.
Data correspond to usage on the plateform after 2015. The current usage metrics is available 48-96 hours after online publication and is updated daily on week days.
Initial download of the metrics may take a while.