Fig. 5
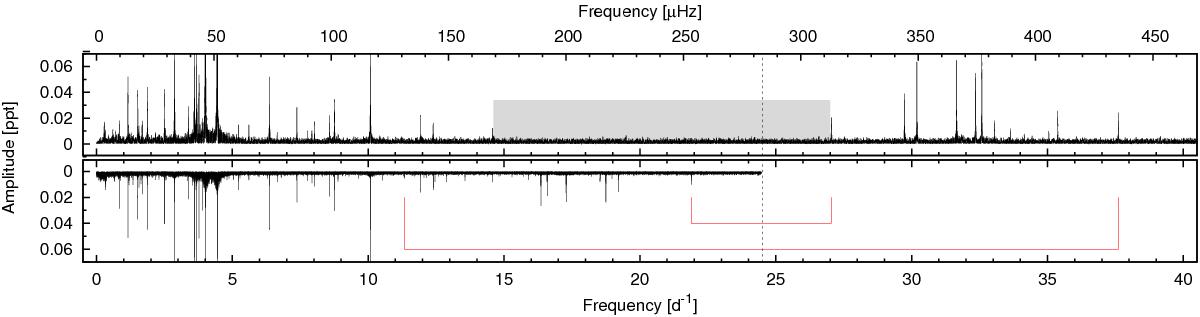
Fourier transforms of the original SC (upper panel) and LC (bottom panel) light curve. The frequency gap between ≈15 and 27 d-1 found in the SC data is indicated with a grey band. The vertical dotted line denotes the Nyquist limit of the LC data. Red lines connect the lowest and highest frequency peaks of the SC data with their Nyquist aliases detected in the LC Fourier transform.
Current usage metrics show cumulative count of Article Views (full-text article views including HTML views, PDF and ePub downloads, according to the available data) and Abstracts Views on Vision4Press platform.
Data correspond to usage on the plateform after 2015. The current usage metrics is available 48-96 hours after online publication and is updated daily on week days.
Initial download of the metrics may take a while.