Fig. 4
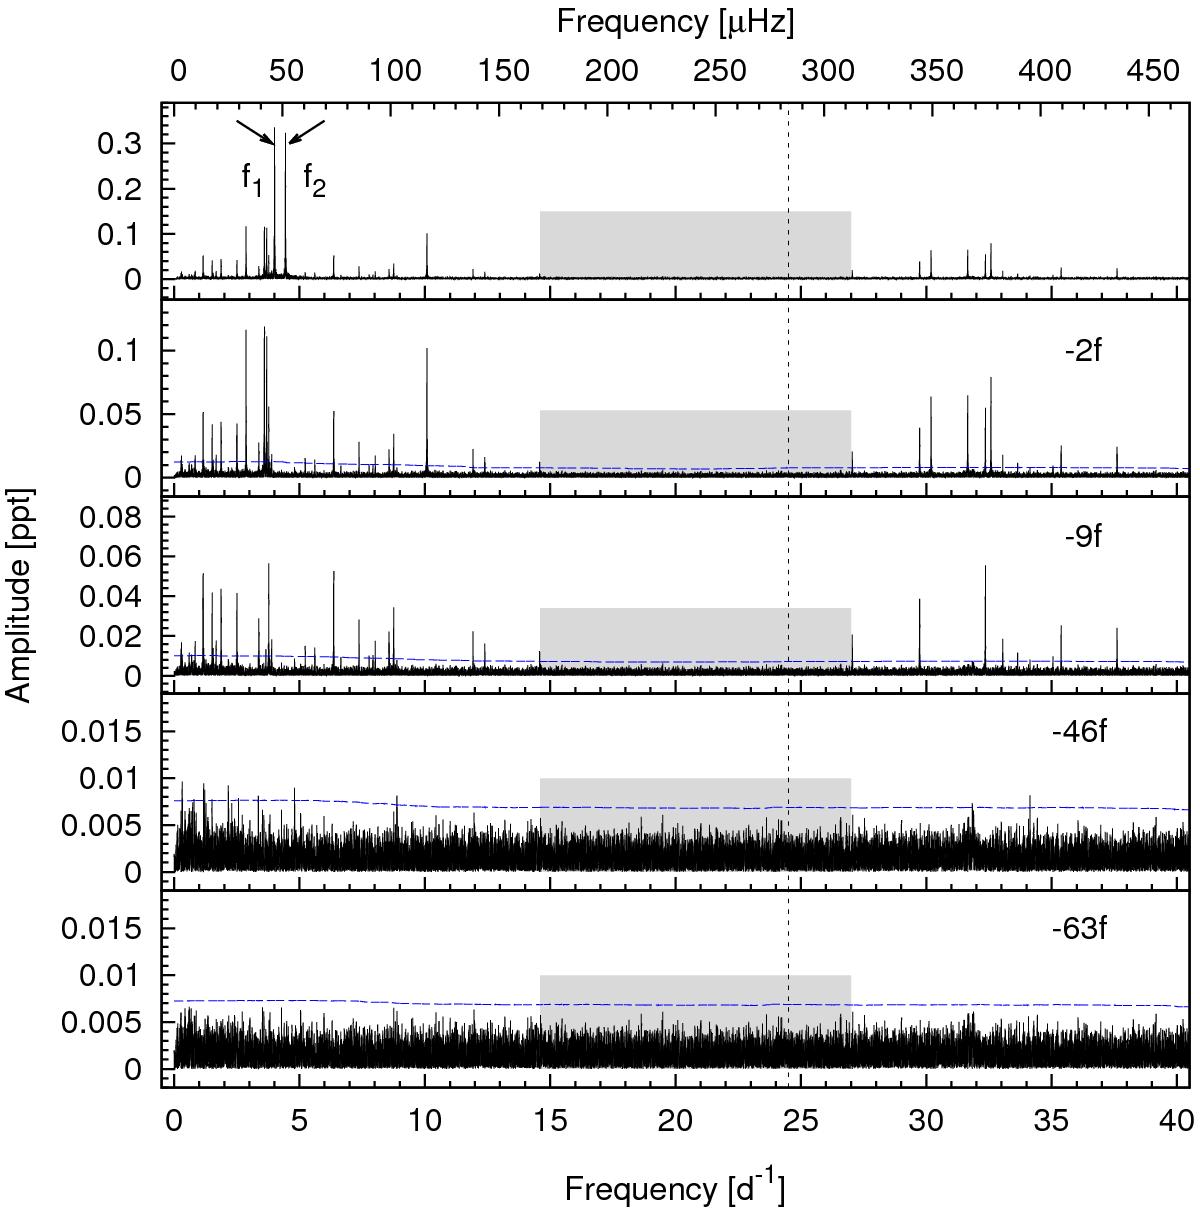
Fourier transforms of the original SC light curve and of the light curve pre-whitened for 2, 9, 46, and 63 frequencies. The blue dashed lines denote the 4 ⟨ A ⟩ significance level, where ⟨ A ⟩ is calculated as the moving average of radius 8 d-1 of the pre-whitened spectrum. The frequency gap between ≈15 and 27 d-1 is indicated with a grey band. The vertical dotted line denotes the Nyquist limit of the LC data.
Current usage metrics show cumulative count of Article Views (full-text article views including HTML views, PDF and ePub downloads, according to the available data) and Abstracts Views on Vision4Press platform.
Data correspond to usage on the plateform after 2015. The current usage metrics is available 48-96 hours after online publication and is updated daily on week days.
Initial download of the metrics may take a while.