Free Access
Fig. 2
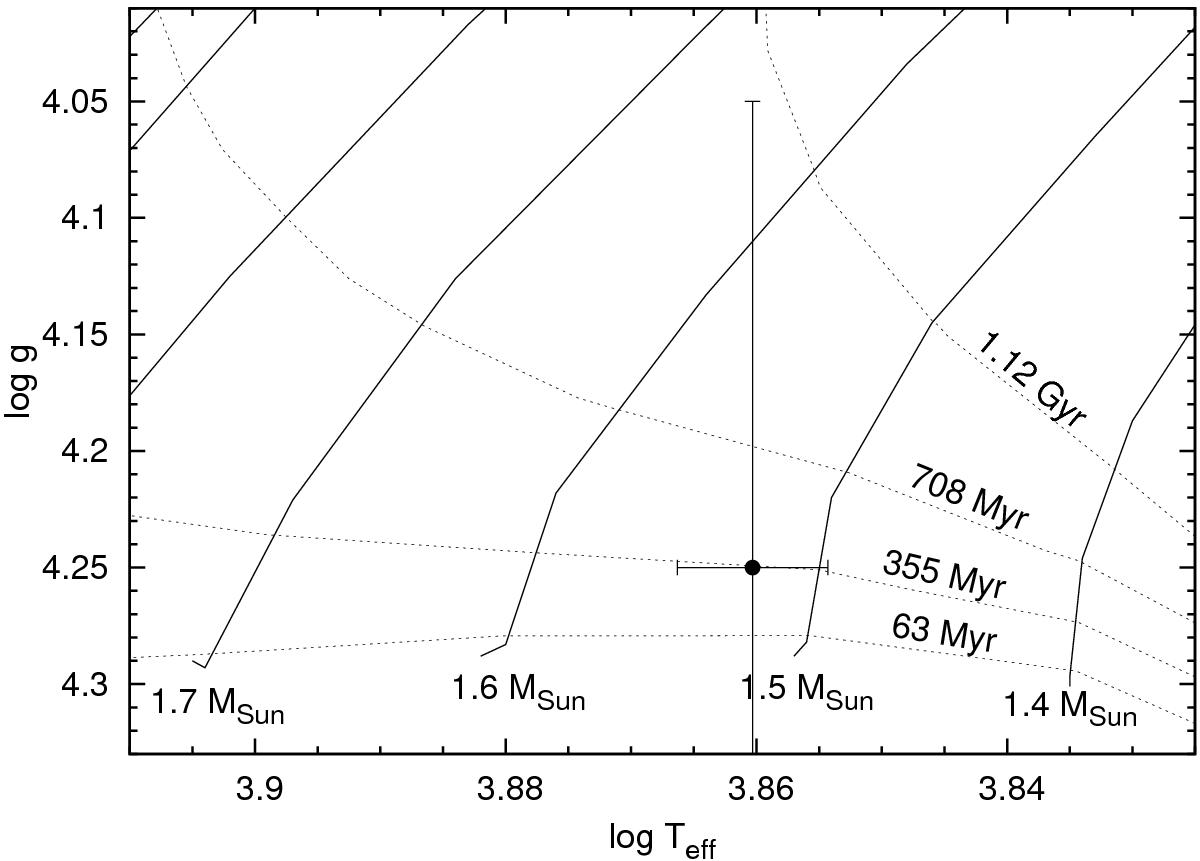
Location of KIC 9533489 on the surface gravity vs. effective temperature diagram. Evolutionary tracks for 1.4, 1.5, 1.6, and 1.7 M⊙, as derived by Girardi et al. (2000) are plotted with solid lines. Dotted lines show 63 Myr –1.12 Gyr isochrones.
Current usage metrics show cumulative count of Article Views (full-text article views including HTML views, PDF and ePub downloads, according to the available data) and Abstracts Views on Vision4Press platform.
Data correspond to usage on the plateform after 2015. The current usage metrics is available 48-96 hours after online publication and is updated daily on week days.
Initial download of the metrics may take a while.